Query Monitor & Profiler
Query Monitor
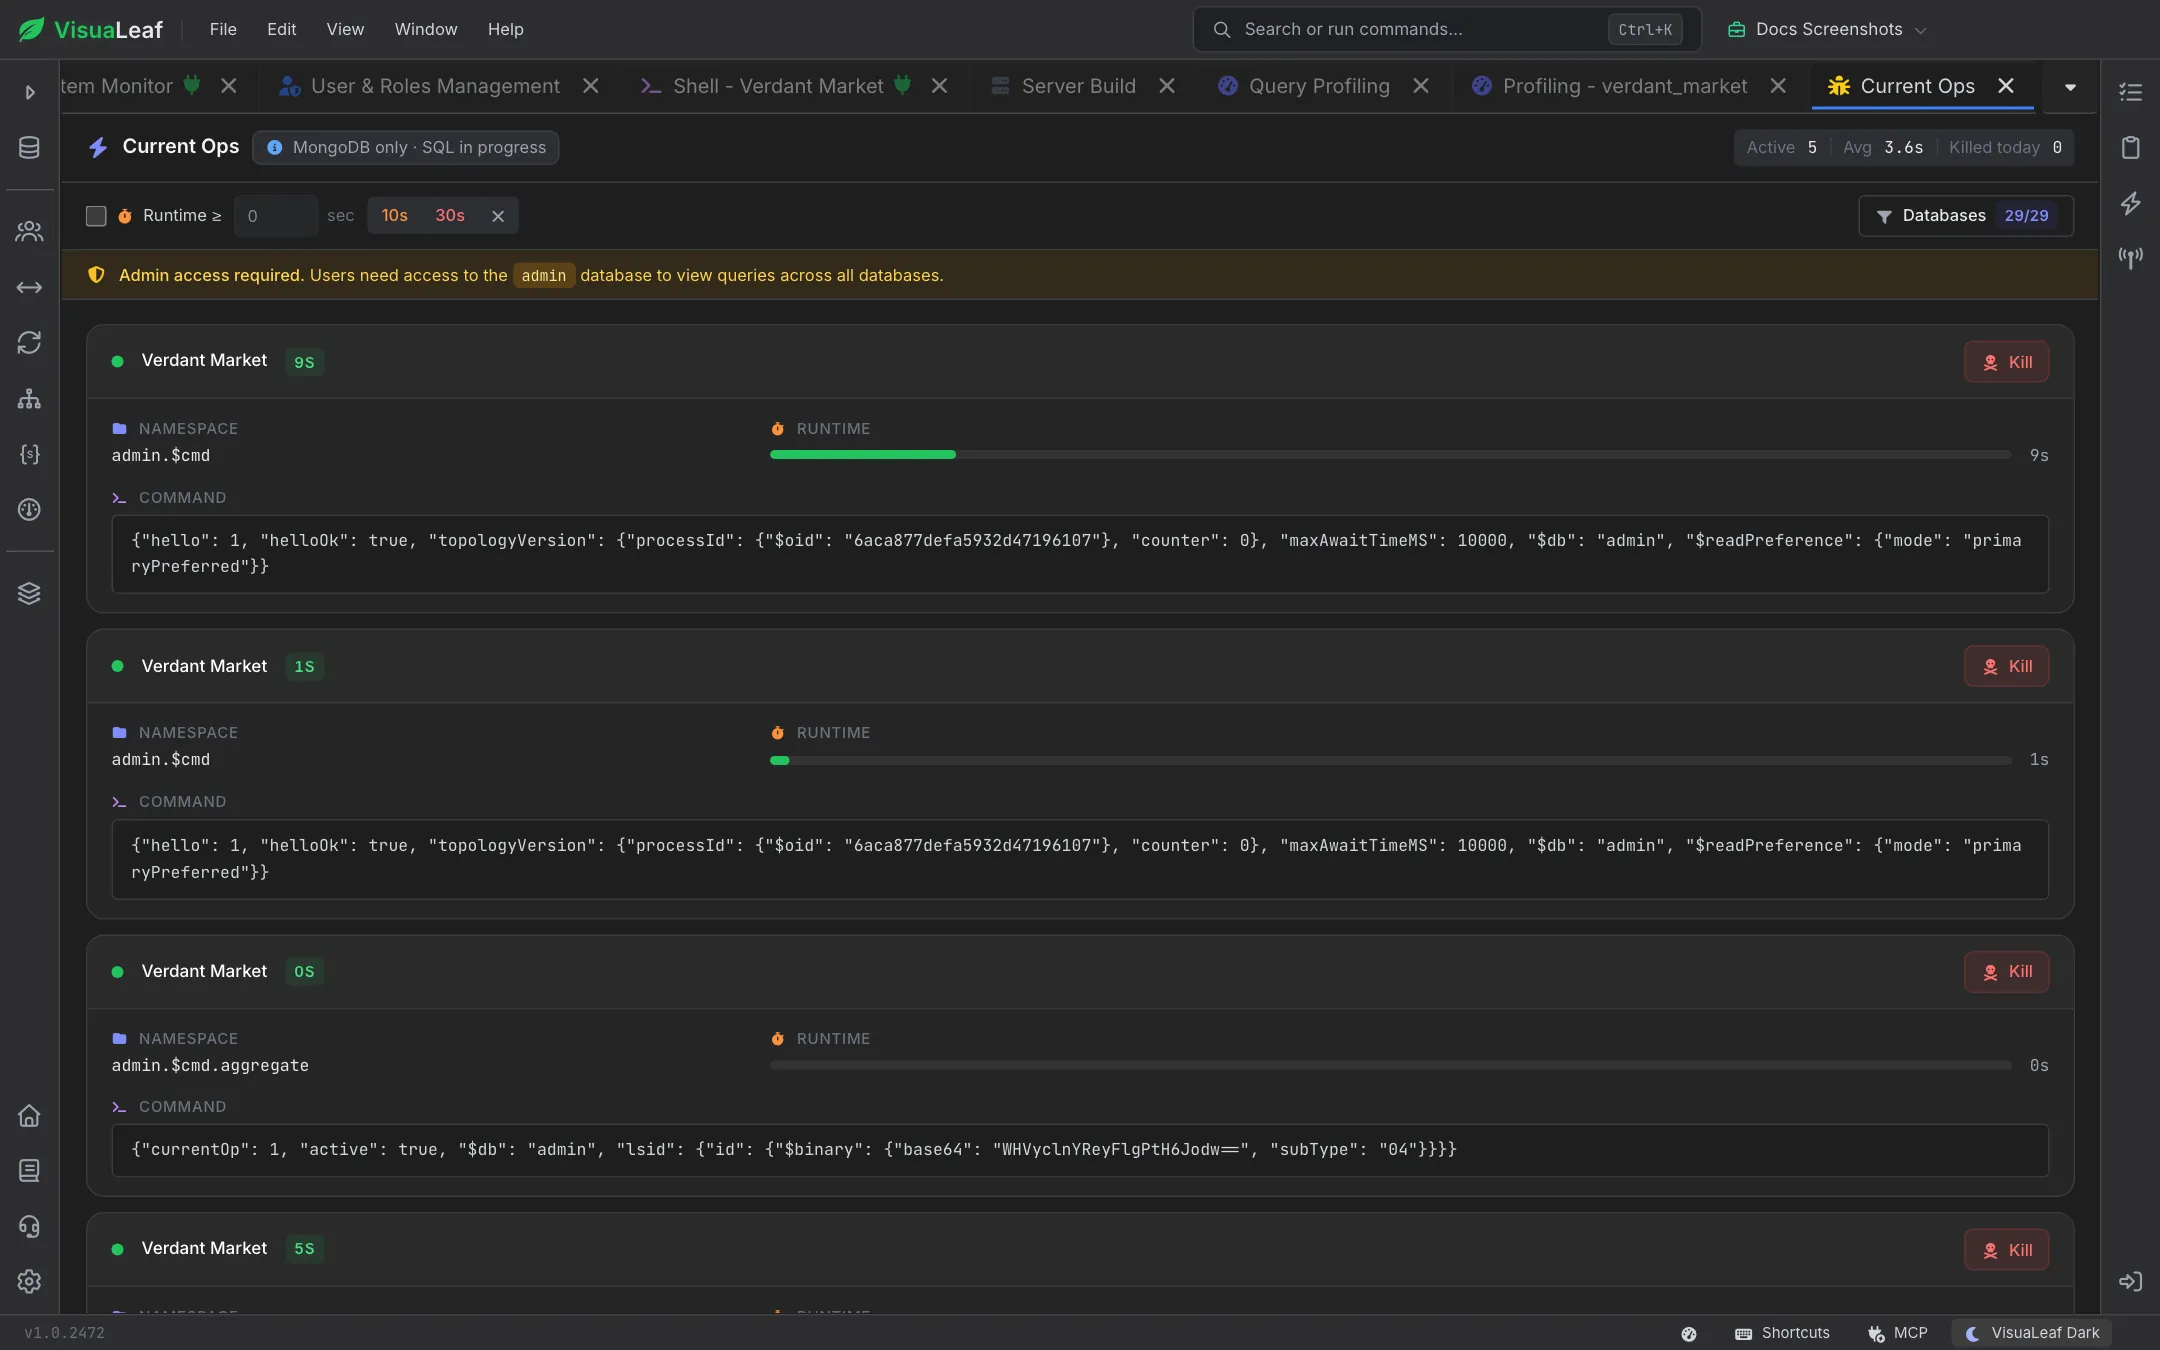
Monitor active database operations in real-time. Identify long-running queries, analyze performance, and terminate problematic operations. The Query Monitor opens as a tab titled Current Ops. It currently covers MongoDB connections; SQL support is in progress, as the badge next to the title notes.
Note: Admin access to the admin database is required to view all running queries. Without admin privileges, you'll only see operations on databases you have access to.
Getting Started
- Connect to your MongoDB database with admin access
- Press Ctrl+K (⌘+K on Mac) and search "Current Ops" — or pin it to the right activity bar with + for one-click access
- View active operations and use filters to find specific queries
- Terminate problematic queries with the Kill button
Interface Overview
Statistics Header
Three metrics at the top right update in real-time:
- Active - Number of running operations matching your filters
- Avg - Average execution time across visible queries (in seconds)
- Killed today - How many queries you've terminated this session
Filter Controls
- Runtime Filter - Show only queries running longer than a threshold. Use preset buttons (10s, 30s) or enter a custom value.
- Database Filter - Select which databases to monitor. Badge shows selected count (e.g., "29/29").
A yellow Admin access required banner under the filters reminds you that users need access to the admin database to see queries across all databases.
Operations List
Each operation displays:
| Field | Description |
|---|---|
| Connection | MongoDB connection name where the query is running, with a badge showing how long it has been running |
| Namespace | Database and collection (format: database.collection) |
| Command | The query being executed |
| Runtime | Execution time with progress bar (maxes at 60s visually) |

Filtering Operations
Database Filter
Click the "Databases" button to open the selection dialog:
- Check/uncheck individual databases
- Select All - Include all databases
- Clear All - Deselect all (shows no operations)
Runtime Filter
- Enable the checkbox next to "Runtime ≥"
- Enter seconds or use presets: 10s (moderately slow) or 30s (very slow)
- Click X to clear and see all operations
Tip: Combine filters - filter your production database with 10s runtime to spot performance issues quickly.
Terminating Operations
- Find the operation in the list
- Click the red Kill button
- Review the Terminate Query dialog (shows the client address, the command, and a warning that this cannot be undone)
- Click Kill Query to confirm or Cancel to abort
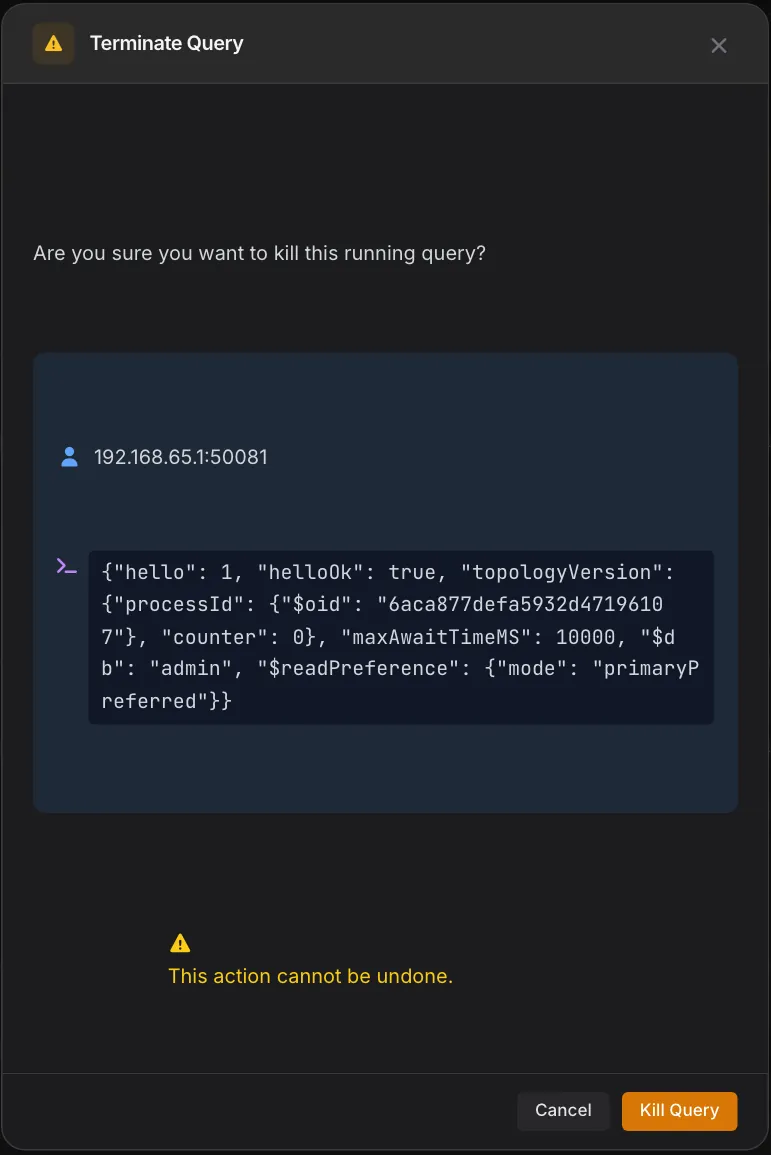
Warning: Killing a query immediately stops the operation and cannot be undone. The client application will receive an error. Verify you're terminating the correct query before confirming.
Empty States
- "No Databases Selected" - Click Databases filter and select at least one
- "No Long-Running Queries" - No queries exceed your runtime threshold
- "No Active Queries" - Database is idle
Common Use Cases
- Finding slow queries - Use 10s or 30s runtime filter, review the command, optimize or add indexes
- Troubleshooting performance - Check for blocking queries when users report slowness
- Stopping runaway queries - Kill unoptimized queries before they impact other users
- Multi-database monitoring - Use database filter to switch between dev/staging/production
- Baseline analysis - Monitor during normal operation to recognize abnormal patterns later
Tips
- Start with 10s filter to catch moderately slow queries worth optimizing
- Watch average runtime over time - gradual increases indicate growing data or degrading indexes
- Check namespace before killing to understand which collection is affected
- Copy the command before killing for later analysis
- High "Killed Today" count suggests underlying issues needing investigation
Related Features
- Database Statistics - Performance metrics and storage stats
- Index Management - Create indexes to improve query performance
- Collection Activity - Query data with performance insights
Ready to try VisuaLeaf?
Download and start managing your MongoDB and SQL databases with ease.
Download Free Trial