SQL Visual Schema (ERD)
SQL Visual Schema (ERD)
Visual Schema draws an entity-relationship diagram of a SQL database. One click lays out every table with its foreign-key relations. You can rearrange and edit tables on the canvas, read or edit the whole diagram as DBML text that stays in step with the cards, review every relation in one list, and Materialize the result to a live database after previewing the exact DDL.
Quick Start
- In the sidebar, right-click a SQL database, its Tables folder, or a table, and choose Visual Schema. You can also click Visual Schema in the toolbar of a database's Tables Info.
- Click Generate to place every table on the canvas with its relations.
- Drag cards to arrange them, and zoom with the controls in the bottom-left corner.
- Open the right panel to see Properties, Relations or the DBML text.
- When you've changed the design, click Materialize to preview and apply the DDL to a database.
Generating a Diagram
Generate builds the diagram from every table in the database. Tables are placed on the canvas and each foreign key is drawn as a line labelled with its constraint name, with 1 and N marking each end.
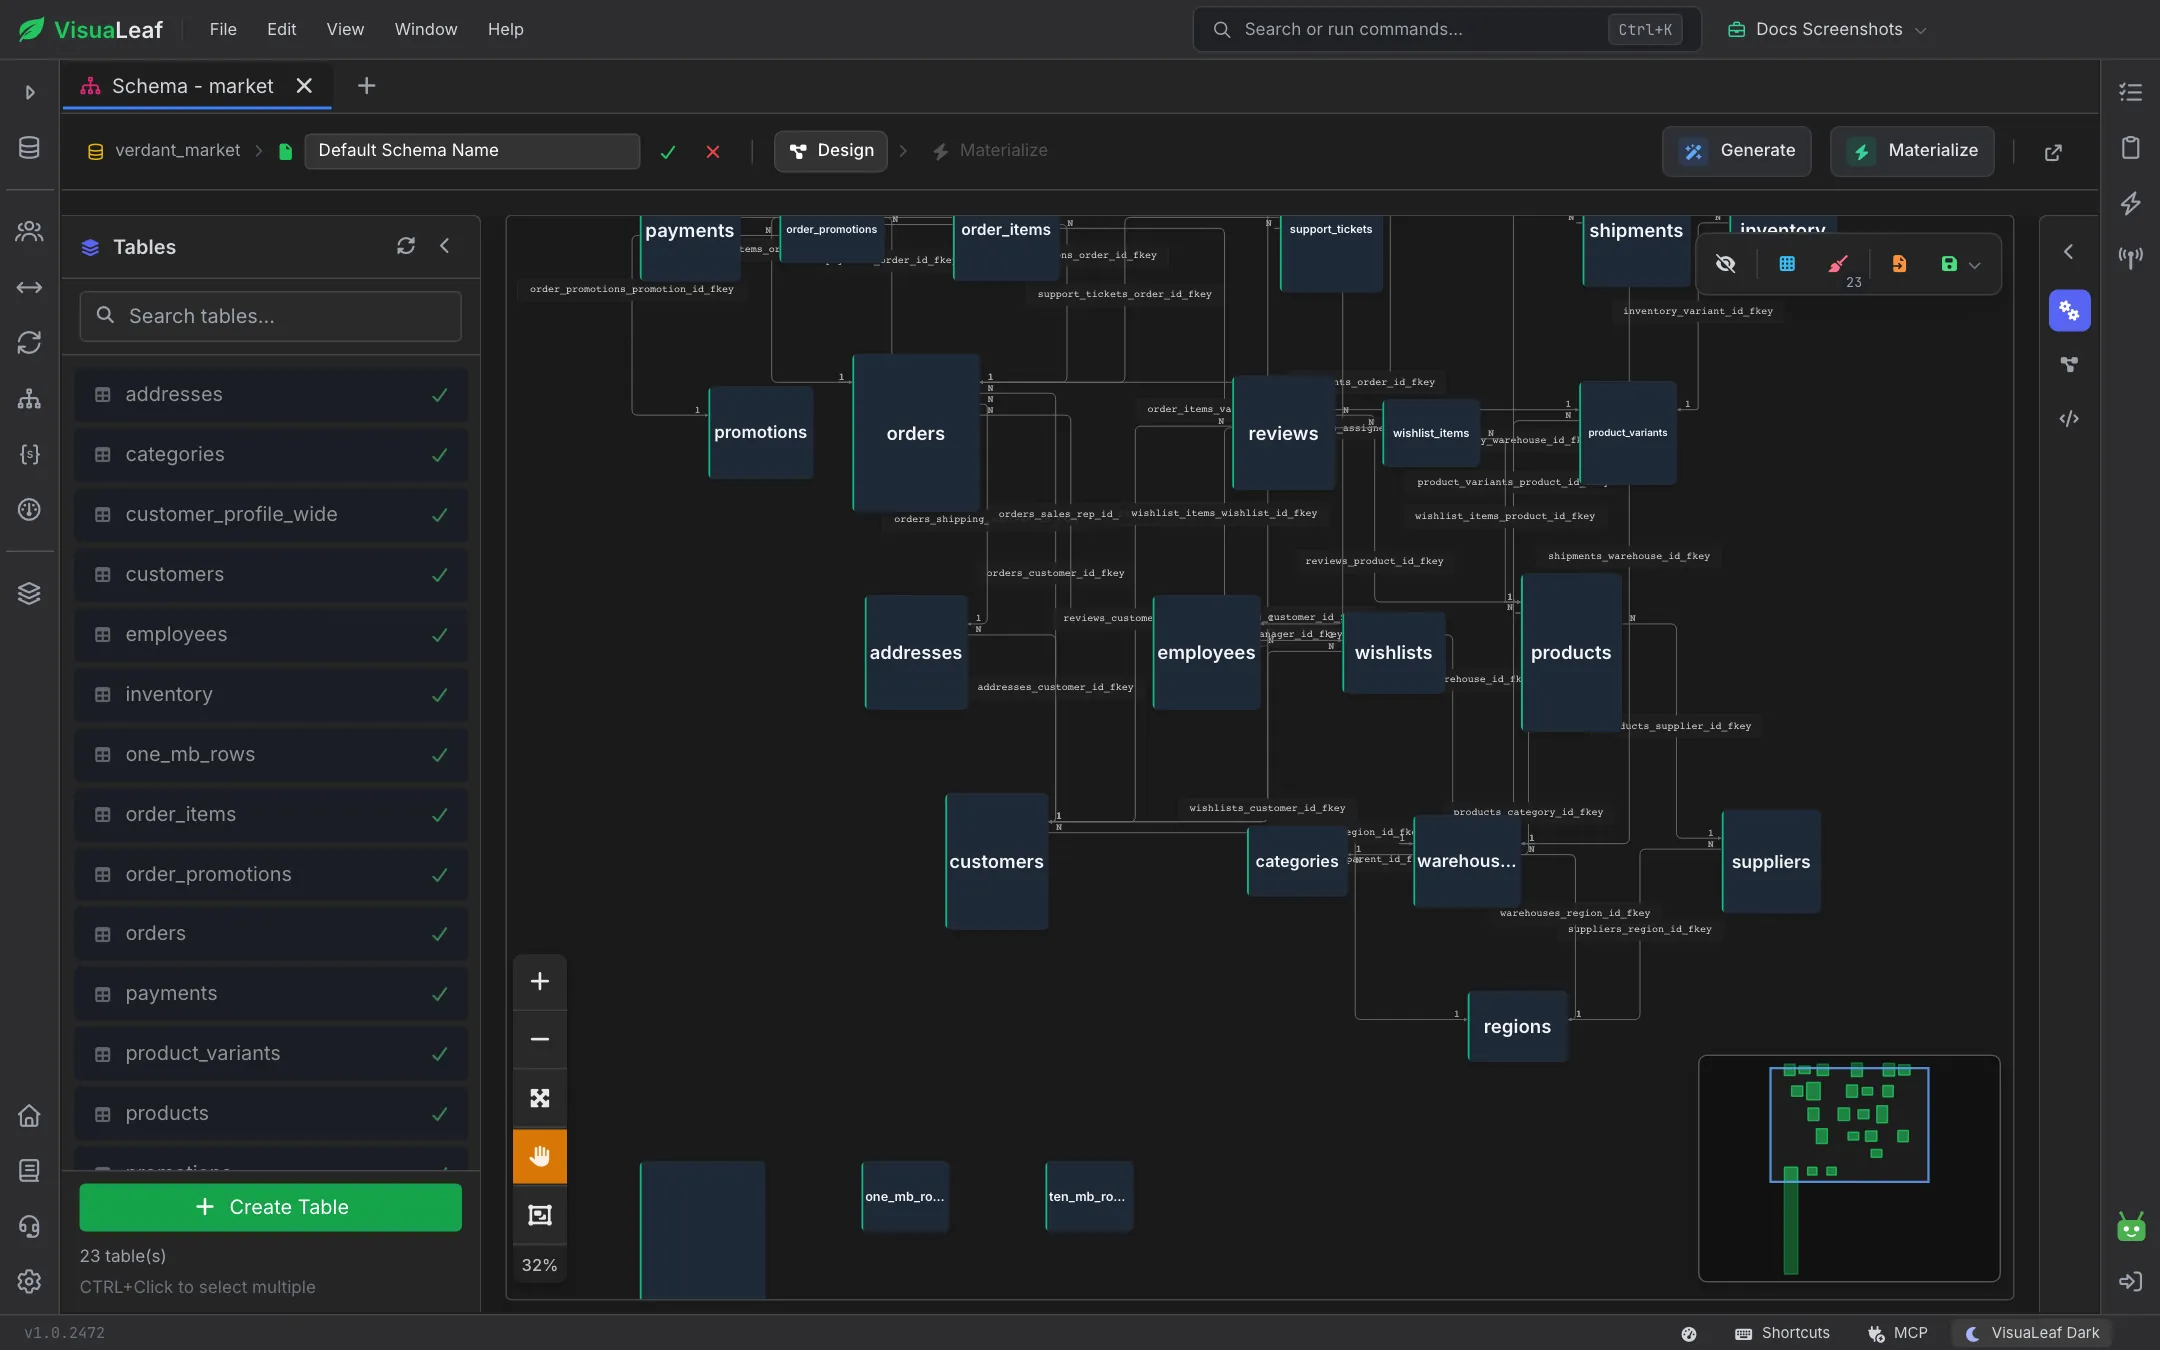
The Tables panel on the left lists every table, with a tick on the ones already on the canvas. Search it, refresh it, Ctrl+Click to select several tables, or click Create Table to add a new one. Opening Visual Schema from a table's context menu brings that table onto the canvas for you.
Working on the Canvas
Each table is a card, and the relation lines follow the cards as you move them.
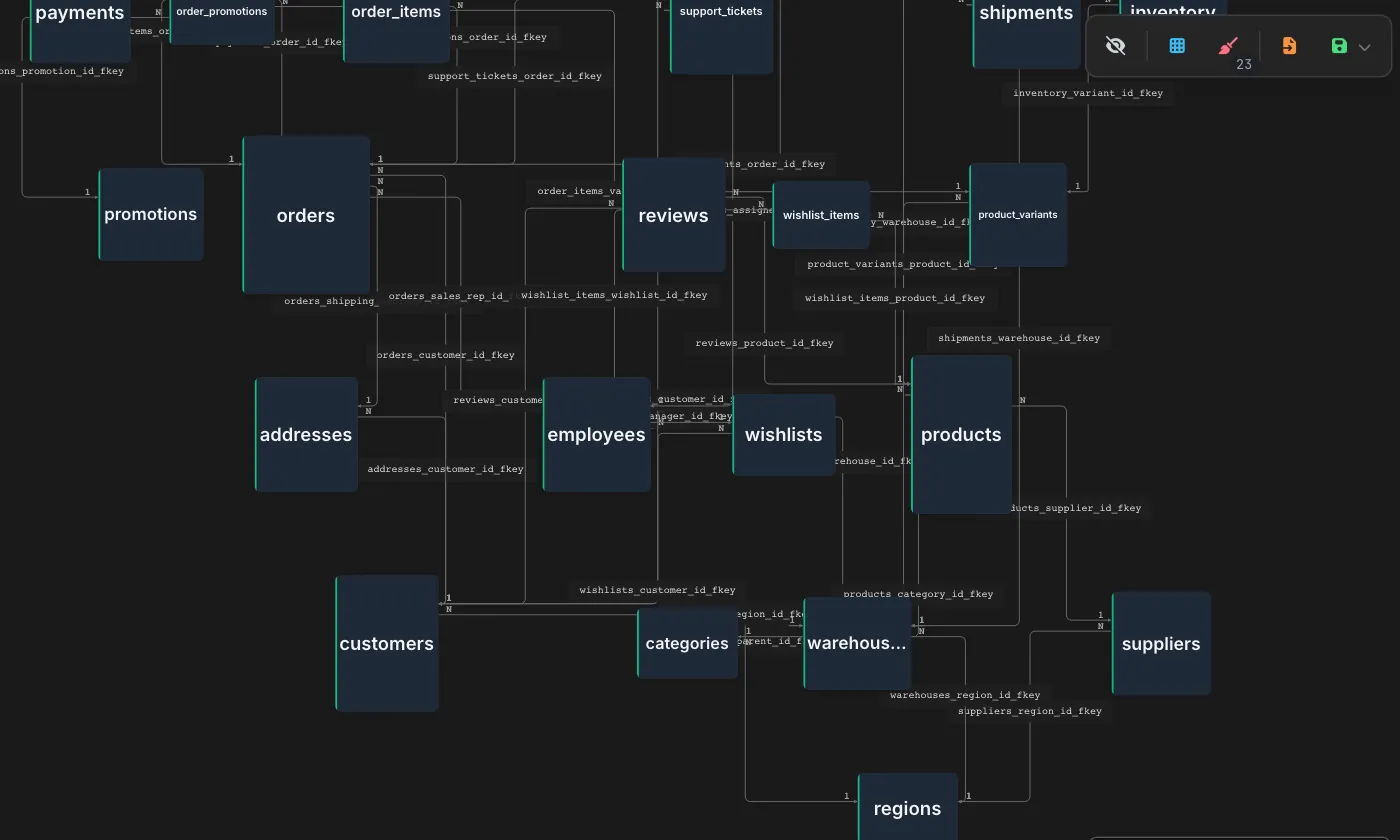
- Zoom and pan: zoom in and out, fit everything to the screen, switch to pan mode, or type a zoom level. A minimap in the corner shows where you are.
- Groups: draw a group rectangle around related tables to label part of the diagram.
- Floating toolbar: show hidden items, arrange tables and detect relationships, clear all tables from the canvas, import a schema from a JSON file, and Save & Export.
Save & Export saves the diagram and exports it as a PNG (color or black and white), an SVG, a standalone HTML file, CREATE TABLE statements, or JSON. Rename the diagram in the header, and use the window button to open it in a separate window.
DBML Text View
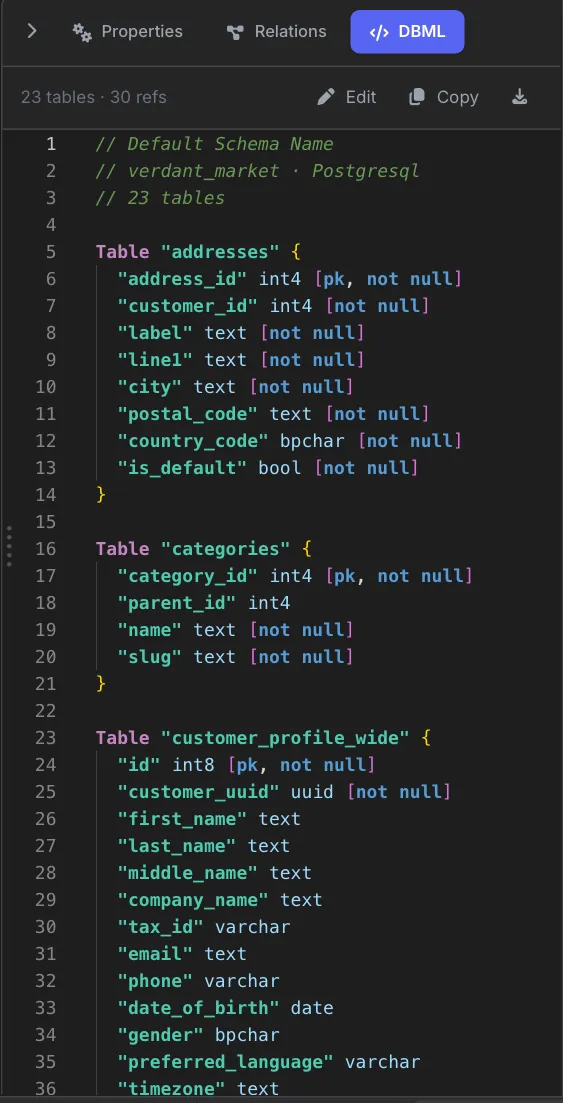
The DBML tab in the right panel shows the whole diagram as DBML text. Every table, column, type and constraint is listed, and the header shows the table and reference counts. The text and the canvas stay in step: move or edit a card and the text updates; edit the text and the cards follow.
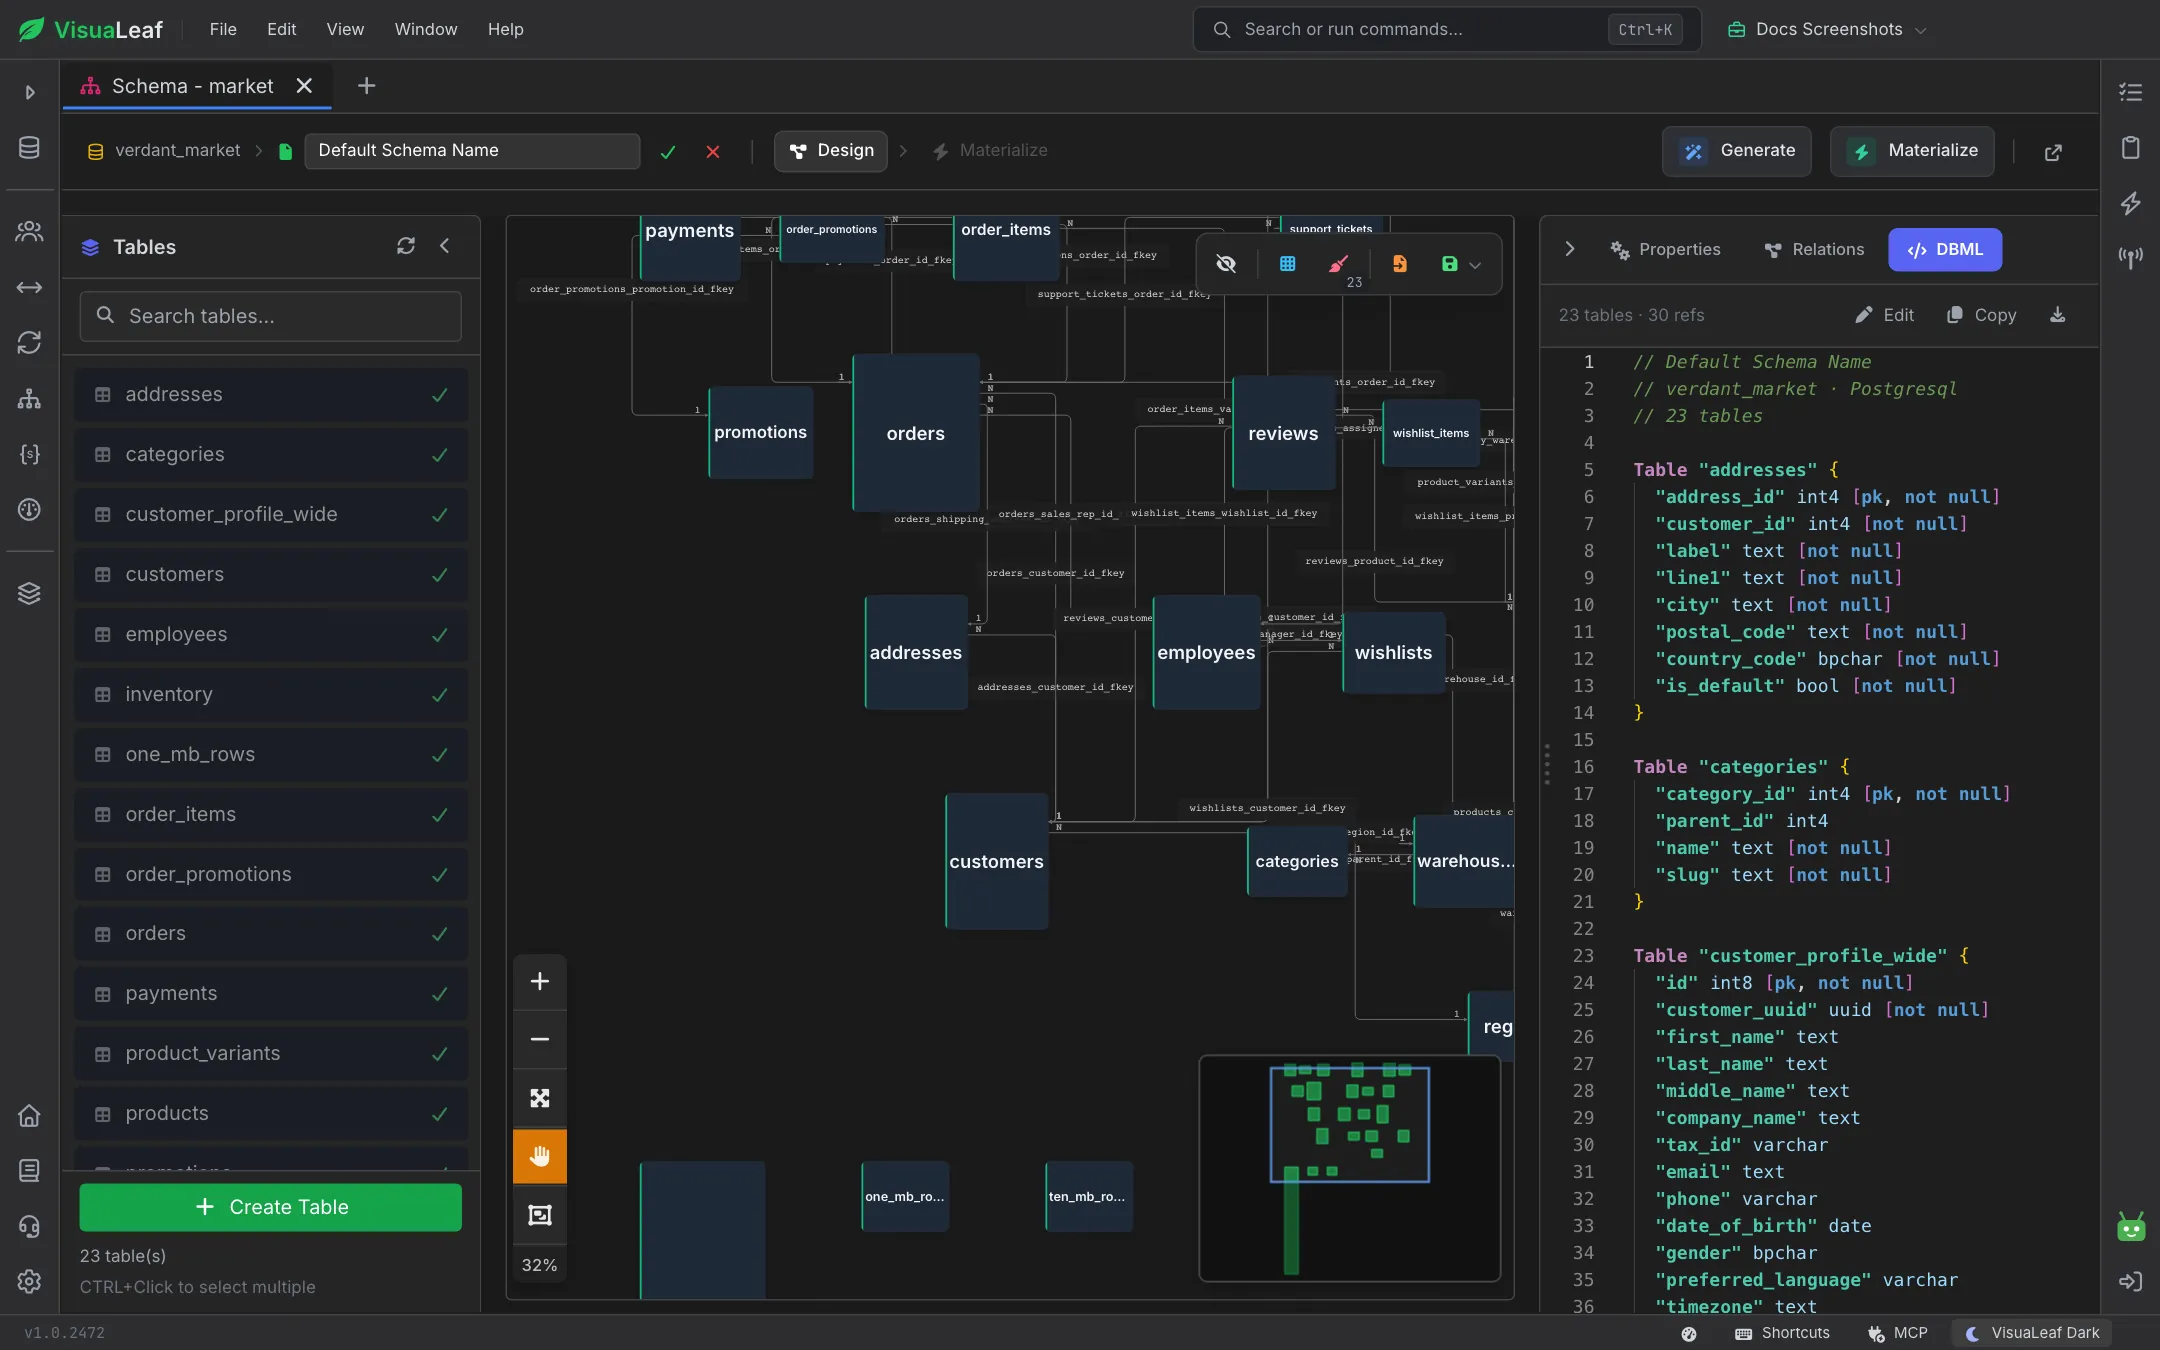
- Edit switches the text to editing mode. Syntax errors are reported against the line they're on.
- Before anything changes, a summary shows what Apply would do: what gets added, removed or changed.
- Paste a DBML document and apply it to build a diagram from text.
- Copy and the download button export the DBML to share or check into a repository.
Relations Panel
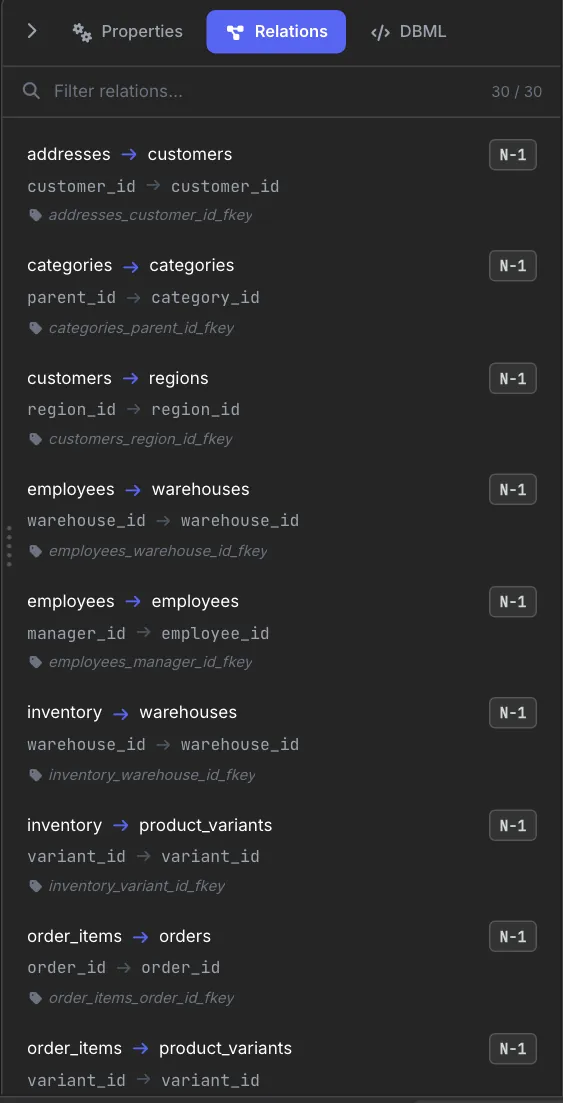
The Relations tab lists every relation in the diagram with a filter box and a count. Each entry shows the two tables, the columns involved, the cardinality (for example N-1) and the constraint name. Click an entry and the canvas frames that relation. Relations that point at a table that is no longer on the canvas, or at a hidden table, are flagged.
The Properties tab shows the details of the selected table and its columns.
Materialize
Tabs move through two steps, shown in the header: Design and Materialize. Click Materialize and pick a target connection. VisuaLeaf runs a dry run first and shows the generated DDL for each table. Review it, then click Apply to Database. Nothing is written until you do. To materialize into two databases side by side, run a target in its own tab.
Designing with the AI Assistant
With a Visual Schema tab open, the AI Assistant can design or change the diagram from a description, for example "add a loyalty_points table linked to customers". Changes that would replace your existing diagram wait for your confirmation before they're applied.
Pro Tips
- Generate, then trim: start from the full database and hide or clear the tables you don't need, rather than adding them one by one.
- Use the Relations filter to check a table's foreign keys quickly instead of following lines on a busy canvas.
- Review in DBML: the text view is the fastest way to check column types and constraints across many tables.
- Read the dry run: the Materialize preview is your last checkpoint. Read the DDL before you apply it to a shared database.
- Export for documentation: an SVG or standalone HTML export makes a clear diagram for wikis and design reviews.
Related Features
- Schema Designer - Visual schema design for MongoDB collections
- SQL Table Info - Columns, indexes and foreign keys of a single table
- SQL Create Table - Define a new table with a form
- SQL Query Builder - Build joins visually using the same foreign keys
Ready to try VisuaLeaf?
Download and start managing your MongoDB and SQL databases with ease.
Download Free Trial