VisuaLeaf Quick Start Guide
Quick Start Guide
This guide takes you from a fresh install to your first query result. It should take about fifteen minutes. You will install VisuaLeaf, create a connection to a database, explore its structure, run a query, and read the results.
VisuaLeaf works with MongoDB and with SQL databases — PostgreSQL, MySQL, MariaDB, SQL Server, Oracle, and SQLite — from the same window. Where the steps differ between the two, this guide shows both.
Before you start
Download and install VisuaLeaf for your platform. Builds are available for macOS (Apple Silicon and Intel), Windows, and Linux.
- Go to the download page and pick the installer for your operating system.
- Run the installer and launch VisuaLeaf.
- Create a free account with just your email — no credit card — to start your 14-day Pro trial. The Community Edition stays free for as long as you like.
You also need a database to connect to. If you do not have one, MongoDB Atlas offers a free tier, or you can point VisuaLeaf at a local mongod, Postgres, or SQLite file.
Step 1: Run VisuaLeaf
When you launch VisuaLeaf, the Welcome screen opens. It shows your license status, quick actions for getting connected (including a one-click Mongo or SQL demo database), and shortcuts to the main features.
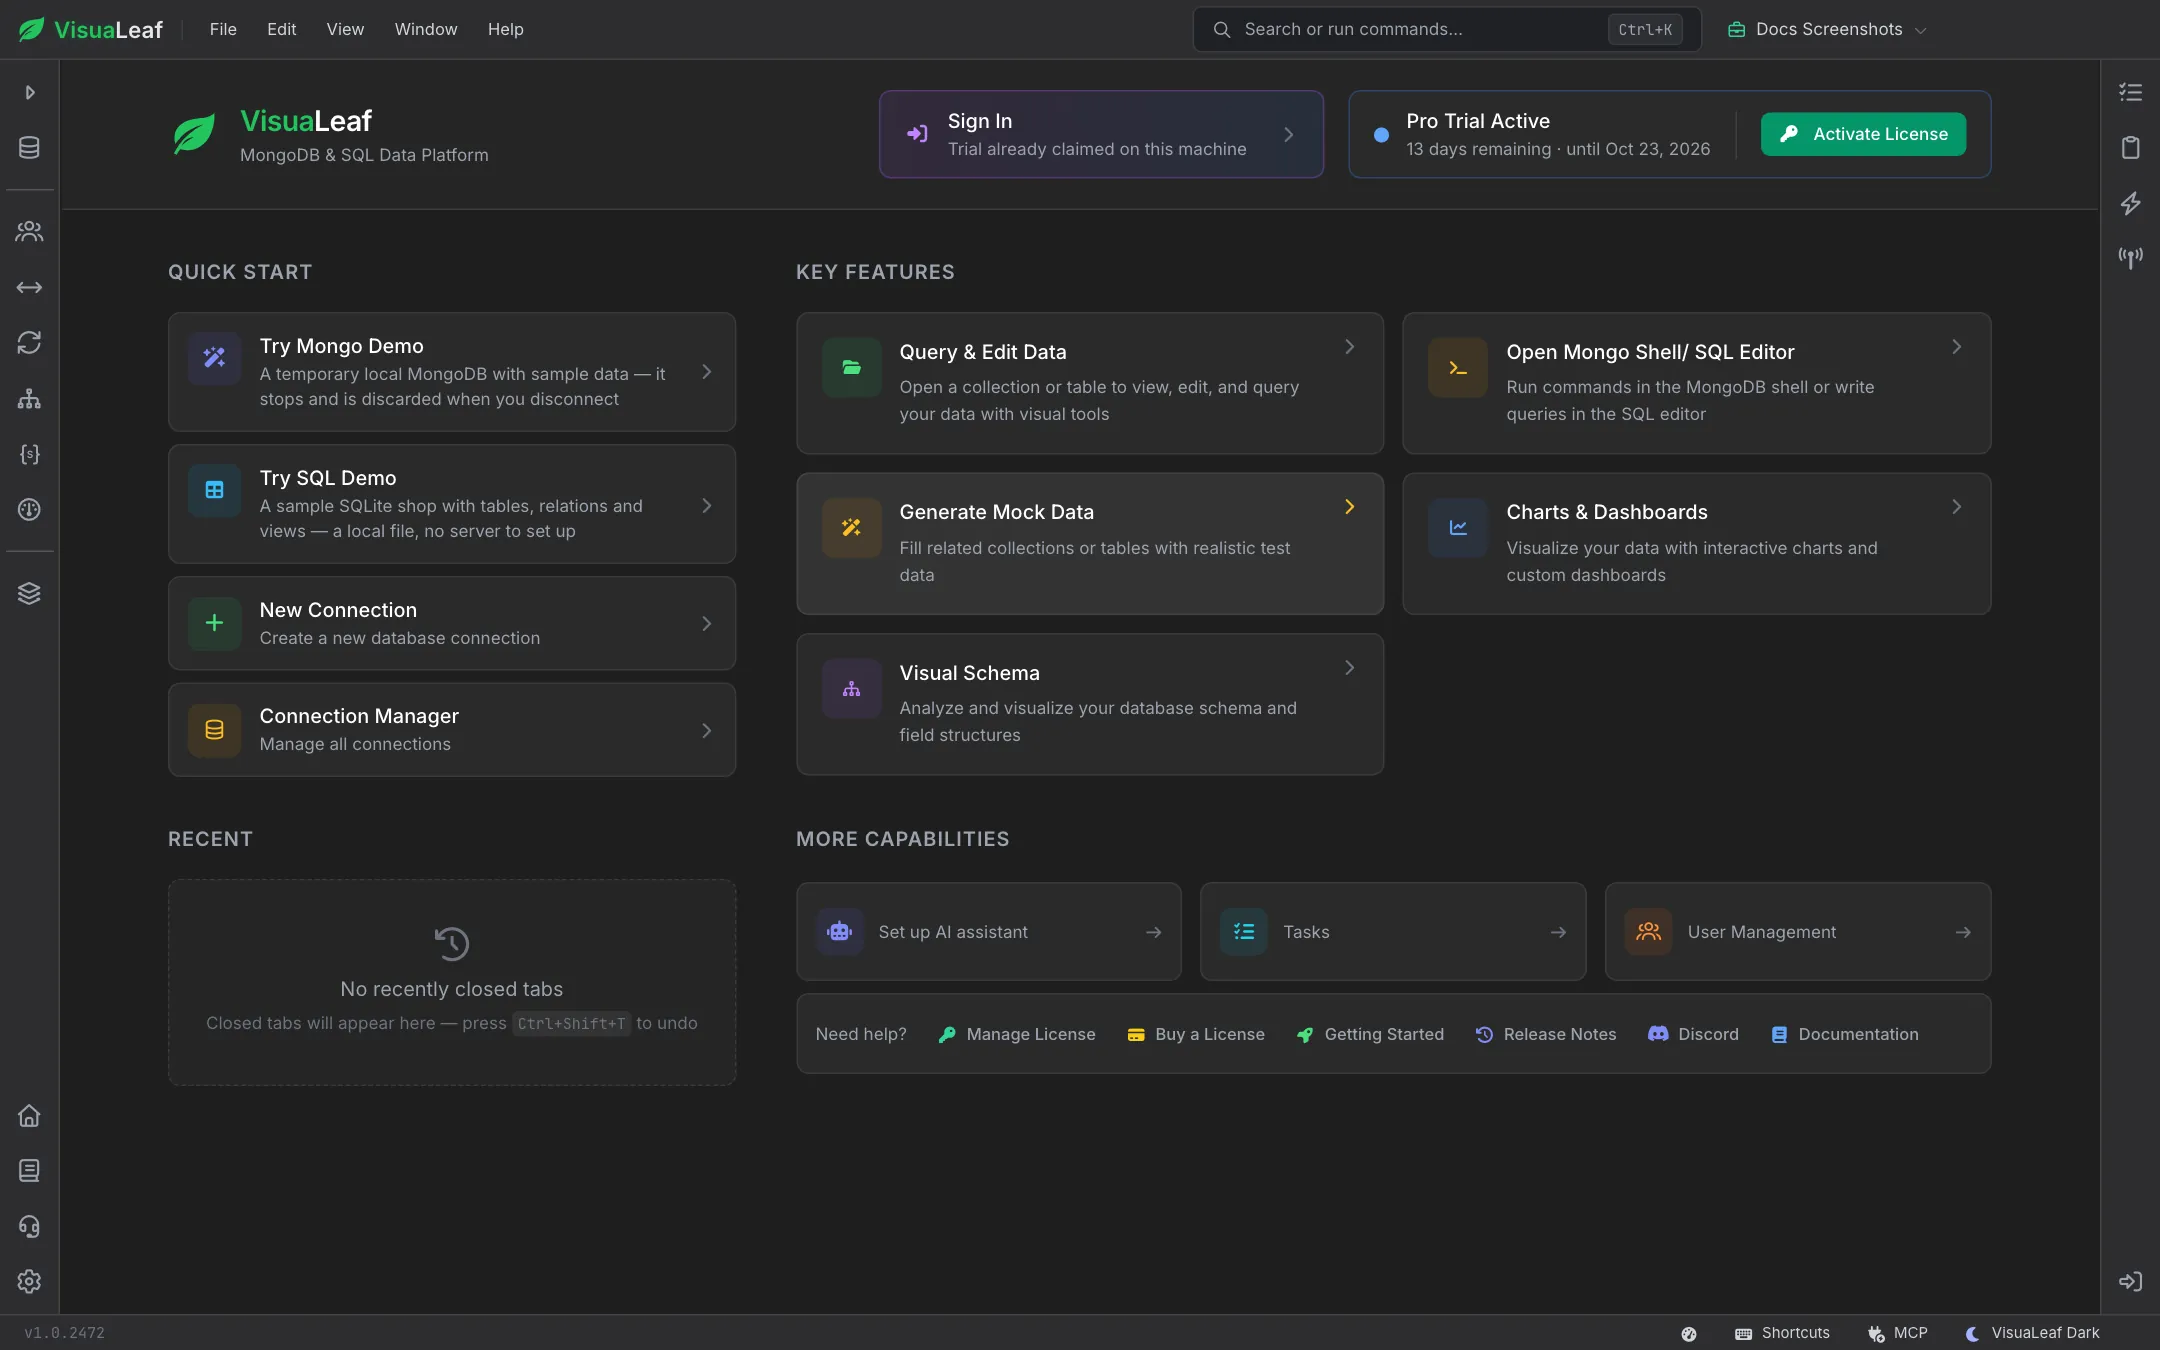
No database handy? Click Try Mongo Demo or Try SQL Demo to open a sample database with no setup, and skip straight to Step 3.
Activate your license
On first launch, a "Welcome to VisuaLeaf" window lets you start a demo, create a connection, or sign in. Registering starts your 14-day Pro trial — it runs from the moment you sign up. If this machine has already claimed its trial, click Sign In in the header to pick up where you left off.
The license card in the header shows your plan and how long it has left — for example "Pro Trial Active, 13 days remaining" — with an Activate License button for entering a license key.
Get to know the workspace
VisuaLeaf is organized around four areas. Everything in this guide happens in one of them.
Sidebar
A tree of your connections, databases, collections, and tables. This is where you navigate. See Sidebar.
Activities
Each thing you open — a collection, a query, an aggregation pipeline, a chart — becomes a tab. Tabs can be split into panels. See Layout System.
Command palette
Press Ctrl + K (Cmd + K on macOS) to jump to any collection or command by typing. See Command Palette.
Status bar
Along the bottom: connection state, row counts, query timings, and running background jobs. See Status Bar.
Step 2: Create a connection
A connection stores everything VisuaLeaf needs to reach one server: the host and port, the database name, credentials, and any TLS or SSH settings. Connections are saved locally and can be grouped into projects and environments — for example a Billing project with dev, staging, and prod environments.
Open the Connection Manager from the Welcome screen or the toolbar, then click New Connection.
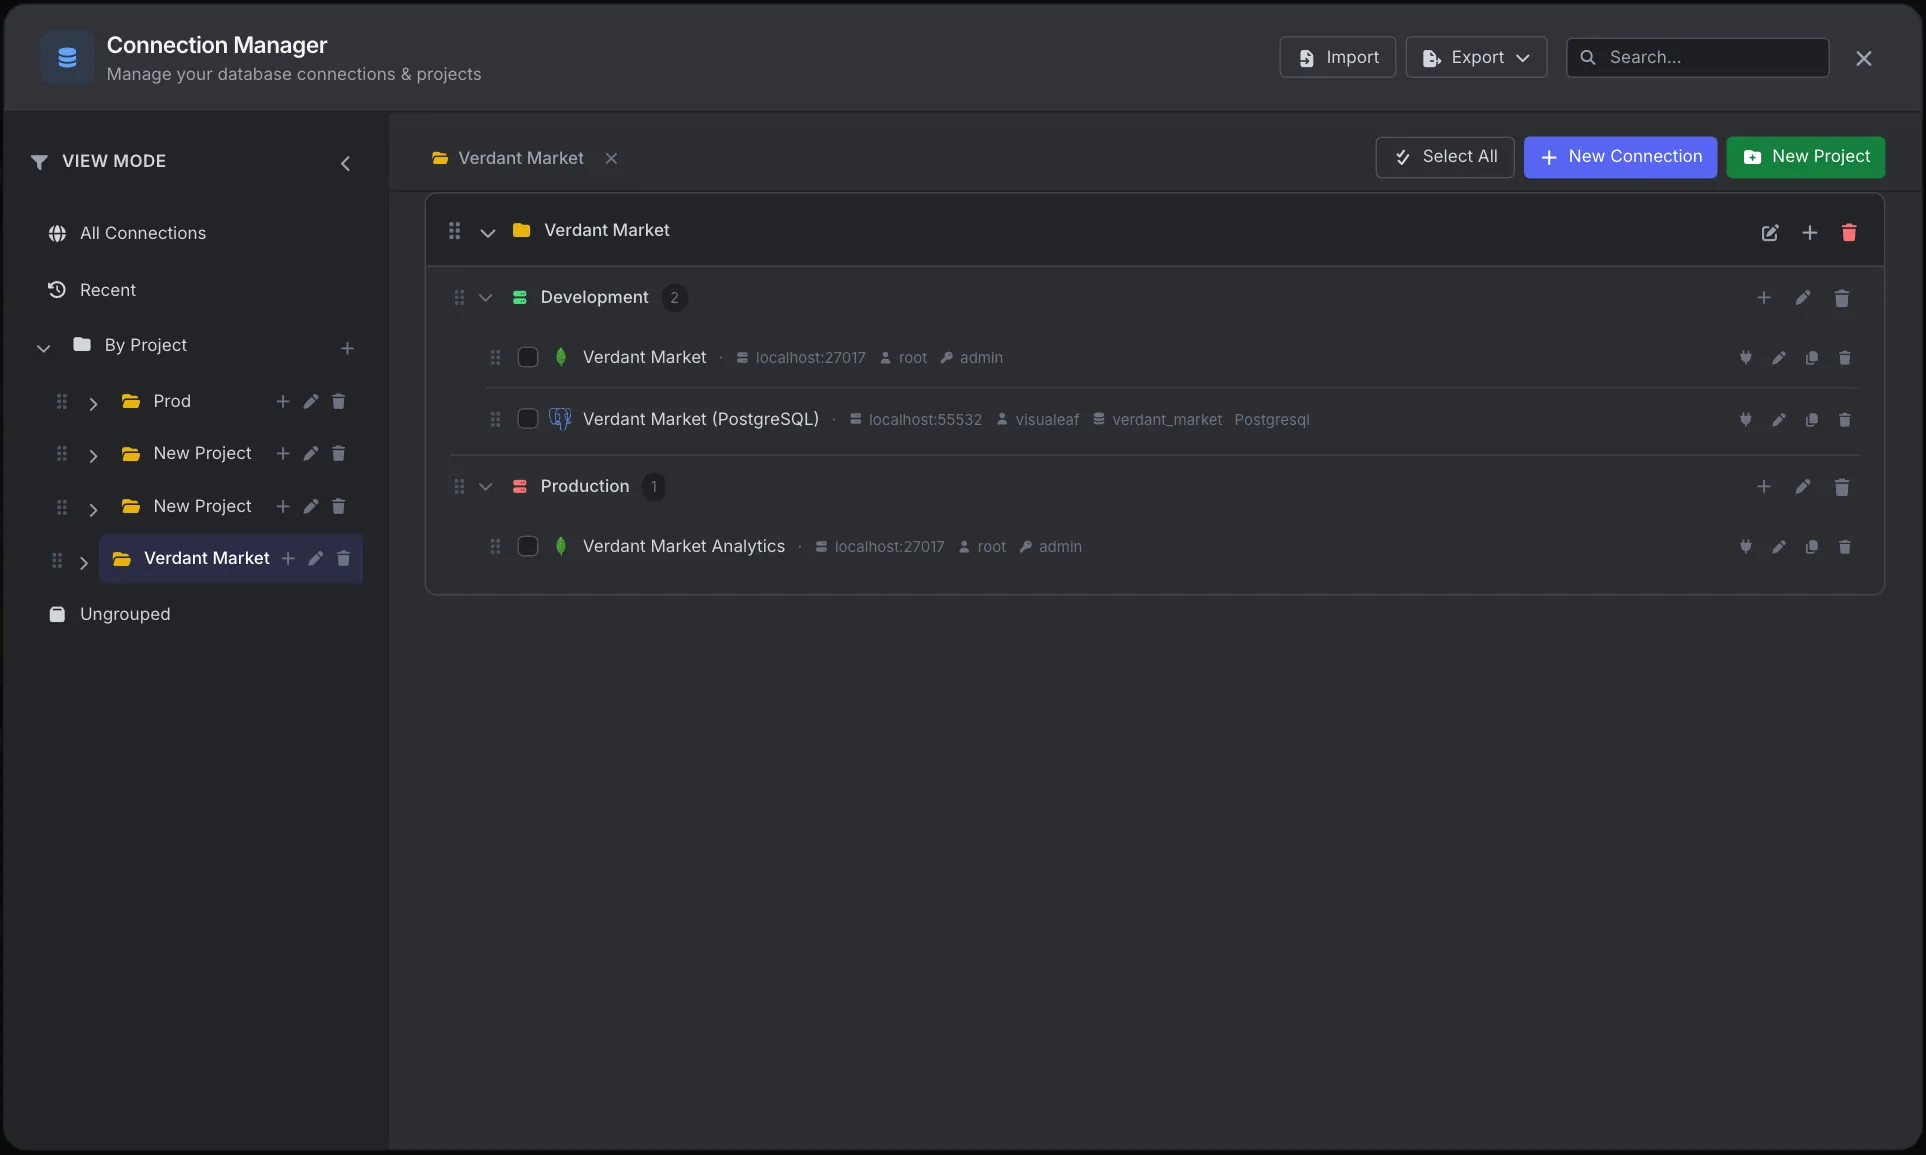
Connect to MongoDB
- Set Database Type to MongoDB.
- Give the connection a name you will recognize later, such as
Billing — staging. - If you already have a connection string, click Create from URL and paste it. VisuaLeaf populates the host, port, credentials, and options across every tab for you. Both
mongodb://andmongodb+srv://Atlas strings work. - If you would rather fill things in by hand, use the Server tab and pick a connection type: standalone, replica set, sharded cluster, or DNS seedlist.
- On the Authentication tab, choose your mechanism. SCRAM-SHA-256 is the default; X.509, AWS IAM, LDAP, Kerberos, and OIDC are also supported.
Connect to a SQL database
PostgreSQL, MySQL, MariaDB, SQL Server, and Oracle follow the same shape:
- Set Database Type to your engine.
- Enter the host and port. The standard ports are
5432for PostgreSQL,3306for MySQL and MariaDB,1433for SQL Server, and1521for Oracle. - Enter the database (or service) name and your username and password.
- Set the SSL mode on the SSL/TLS tab if your server requires an encrypted connection.
Connect to SQLite
SQLite has no server. Set Database Type to SQLite and point VisuaLeaf at the database file on disk. There is no host, port, or authentication to configure.
Test and save
Click Test Connection. It validates the configuration without saving it, and shows step-by-step progress through network connectivity, authentication, the SSL/TLS handshake, and database access — so when something fails you can see which stage it failed at. When the test passes, click Save & Connect.
Connecting through a bastion host
If your database is not reachable directly, open the SSH Tunnel tab and enter your jump host, port, and either a password or a private key. VisuaLeaf opens the tunnel and routes the connection through it — you do not need to run ssh -L in a separate terminal.
Step 3: Explore the database
After connecting, your server appears in the sidebar as a tree. Expand it to work down through the hierarchy.
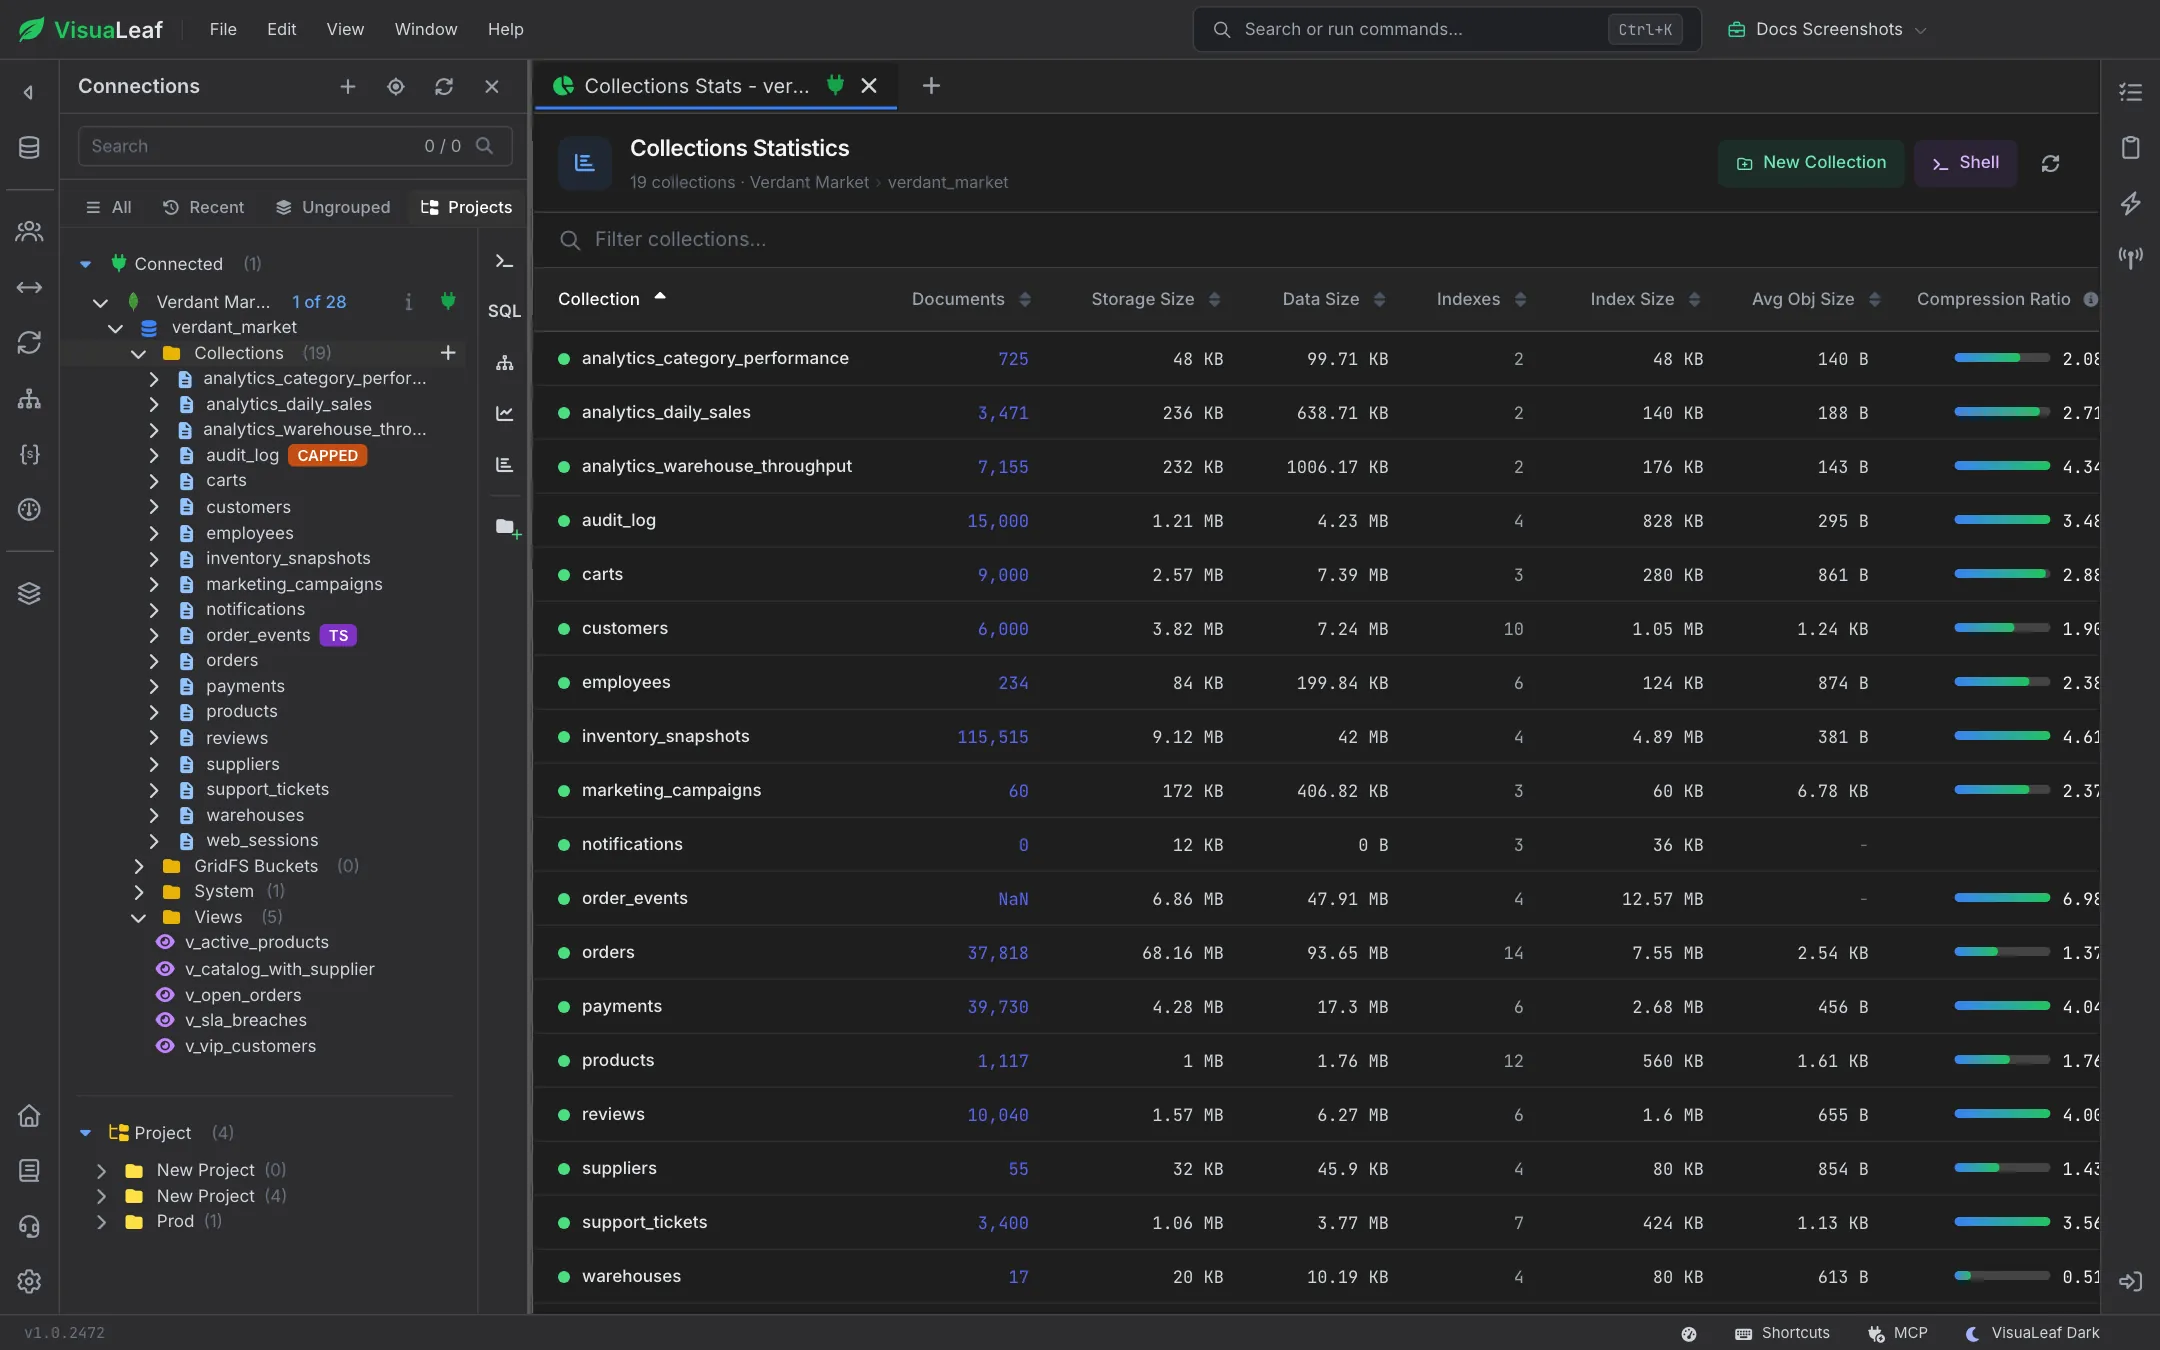
- Connection → expand to list databases.
- Database → expand to list collections, GridFS buckets, system collections, and views (MongoDB), or schemas and tables (SQL).
- Collection or table → click to open it in a new tab.
Two things worth learning early:
- The search box at the top of the sidebar filters the whole tree as you type, so you do not have to expand your way down to a collection you already know the name of. The All, Recent, Ungrouped and Projects buttons below it switch how connections are listed.
- Right-clicking any node opens a context menu with the operations that apply to it — export, index management, statistics, drop, rename, and so on.
Step 4: Run your first query
Query a MongoDB collection
Click a collection in the sidebar. It opens in the Collection View, already showing the first page of documents.
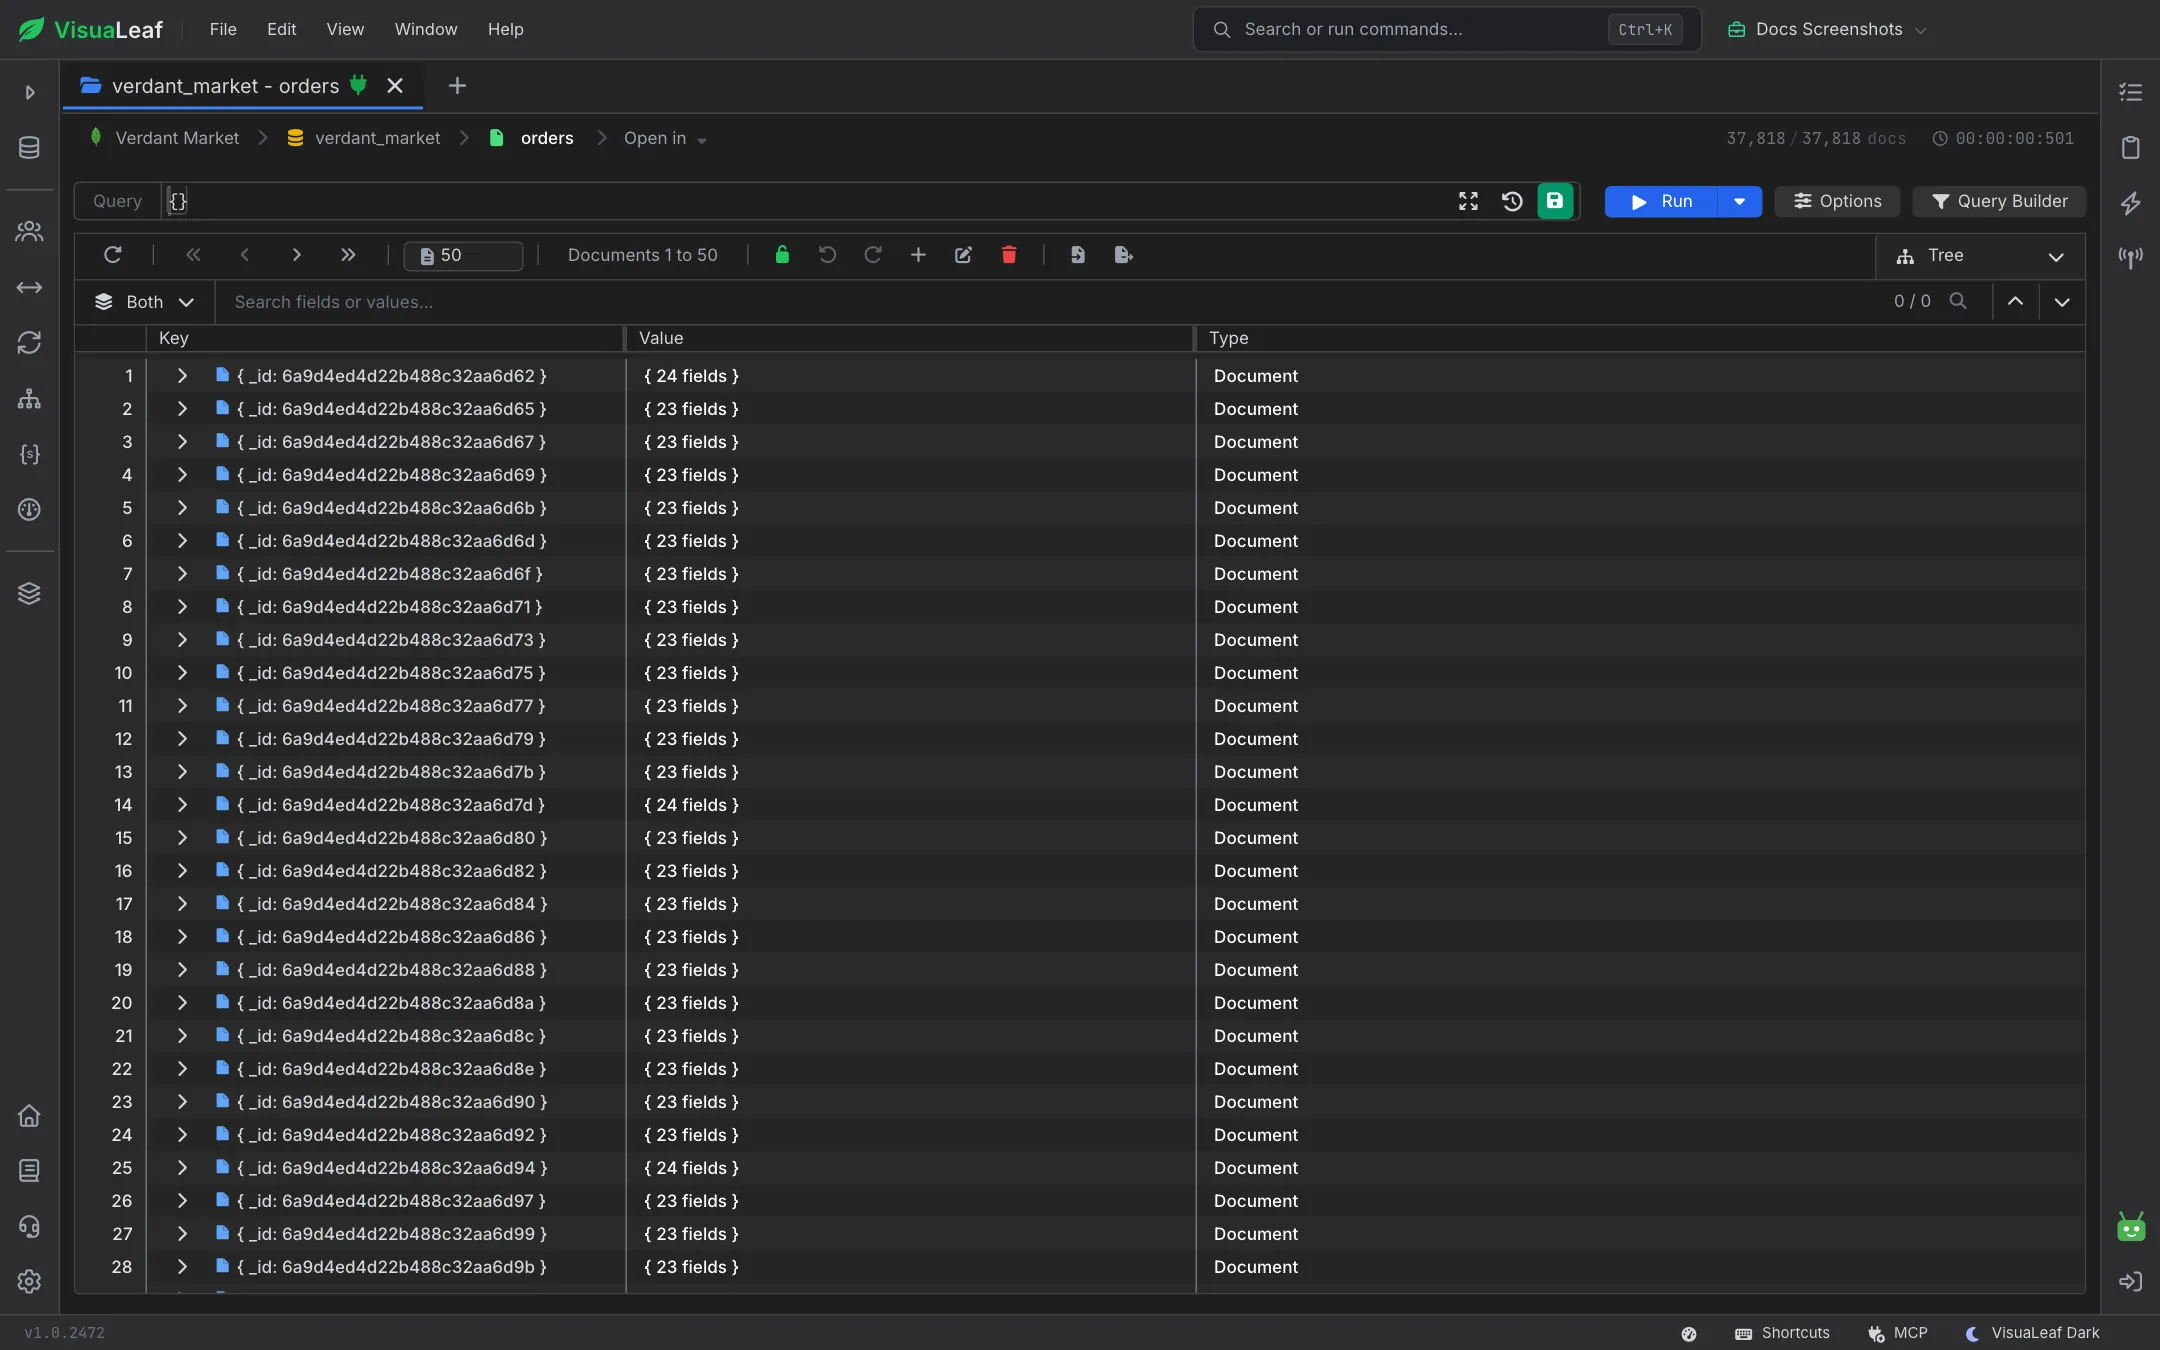
- Type a filter into the Query field, for example
{ status: "active" }. - Press
Enteror click Run. - Results replace the document list below.
If you would rather not write the filter by hand, toggle the Query Builder and assemble conditions from dropdowns. The builder and the raw query stay in sync, so you can start visually and switch to text once you know what you want.
Query a SQL database
For SQL connections, open the SQL Editor from the activity bar or with Ctrl + Shift + S.
- Type a statement, for example
SELECT * FROM customers WHERE country = 'FR';. Autocomplete suggests table and column names as you type. - Press
F5to run the whole buffer, or highlight a fragment and pressF9to run just the selection. - If the buffer holds several statements separated by
;, you get one result tab per statement.
Or describe what you want in English
Configure a provider under Settings → AI Assistant (OpenAI, Anthropic, Google Vertex AI, or a local Ollama endpoint), then describe your query in plain language — "find users who signed up this month with active subscriptions". Review the generated query and click Use Query to drop it into the query builder, pipeline builder, or shell. See AI Assistant.
Step 5: View, sort, and filter the data
Results are shown in whichever view suits the shape of your data. Switch between them at any time.
Tree View Ctrl + 1
Documents as expandable nodes. Best for nested structures and arrays.
Table View Ctrl + 2
A spreadsheet grid, one row per document. Best for flat, uniform data.
BSON View Ctrl + 3
Raw BSON with types spelled out. Best when types matter.
- Sort by clicking a column header in Table View, or by setting a sort document in the query bar.
- Search within the loaded results with
Ctrl+F. - Refresh with
F5to re-run the current query against the server.
Check how the query ran
Click Explain in the toolbar to see the execution plan. Pick a verbosity — Query Planner, Execution Stats, or All Plans — and read whether the query used an index or scanned the collection. This is the fastest way to find out why something is slow. See Query Profiler.
Step 6: Edit and export
Click any value in Tree or Table View to edit it inline. The input is type-aware — dates, ObjectIds, Decimal128, and arrays are validated as you type — and the change is saved as soon as you commit it. Every mutation goes through the command history, so Ctrl + Z undoes it and Ctrl + Shift + Z redoes it.
To get data out, right-click a collection or database in the sidebar and choose Export Data:
- Pick a target format — JSON, CSV, SQL, BSON, or another MongoDB collection.
- Configure field mapping and transformations if you need to reshape the output.
- Click Execute to run it now, or Save to schedule it.
Long-running exports run in the background. Track them in Data Transfer.
Keyboard shortcuts worth learning
On macOS, use Cmd wherever Ctrl is listed.
| Shortcut | Action |
|---|---|
Ctrl + K | Open the command palette |
Ctrl + F | Search within the current results |
Ctrl + 1 / 2 / 3 | Switch to Tree / Table / BSON view |
Ctrl + Shift + S | Open the SQL Editor |
F5 | Refresh results, or run the whole SQL buffer |
F9 | Run the selected SQL fragment |
Ctrl + F5 | Run SQL up to the cursor |
Where to go next
You now have a working connection and can read your data. These are the features most people reach for next:
Aggregation Pipelines
Build multi-stage pipelines by dragging stages, with a live preview of the data at each step.
Charts & Dashboards
Turn a query or pipeline into a chart, then collect charts into a dashboard.
Index Management
Review index usage, spot missing indexes, and create new ones without dropping to the shell.
Schema Designer
See what your documents actually contain — field types, frequencies, and relationships — as a diagram.
MongoDB Shell
A full mongosh-compatible shell against the same connection, for anything the GUI does not cover.
Data Sync
Copy or continuously sync data between databases — MongoDB to MongoDB, or MongoDB and SQL in either direction.
If something does not work
The connection test fails
Look at which stage of the test failed. Stalling on network connectivity usually means a firewall or an Atlas IP allowlist; failing at authentication means the mechanism on the Authentication tab does not match what the server expects; failing at the TLS handshake points at the SSL/TLS tab.
Atlas rejects the connection
Add your current IP to the Atlas Network Access allowlist, and make sure you pasted the mongodb+srv:// string with your real password substituted for the <password> placeholder.
Features are locked
Most features need an active trial or license. Click Sign In or Activate License in the Welcome screen header.
A query is slow
Run Explain on it. If the plan shows a collection scan, the fix is almost always an index — see Index Management.
Still stuck? Ask in Discord or send us a note from the contact page.
Related pages
- Welcome Screen — reference for everything on the start screen
- Connection Manager — every connection option in detail, including TLS, SSH, and auth mechanisms
- Sidebar — navigating databases, collections, and views
- Collection View — the three result views and what each is good for
- Layout System — tabs, split panels, and workspace management
- Command Palette — reaching anything by typing
Ready to try VisuaLeaf?
Download and start managing your MongoDB and SQL databases with ease.
Download Free Trial