SQL Table Statistics
Tables Info
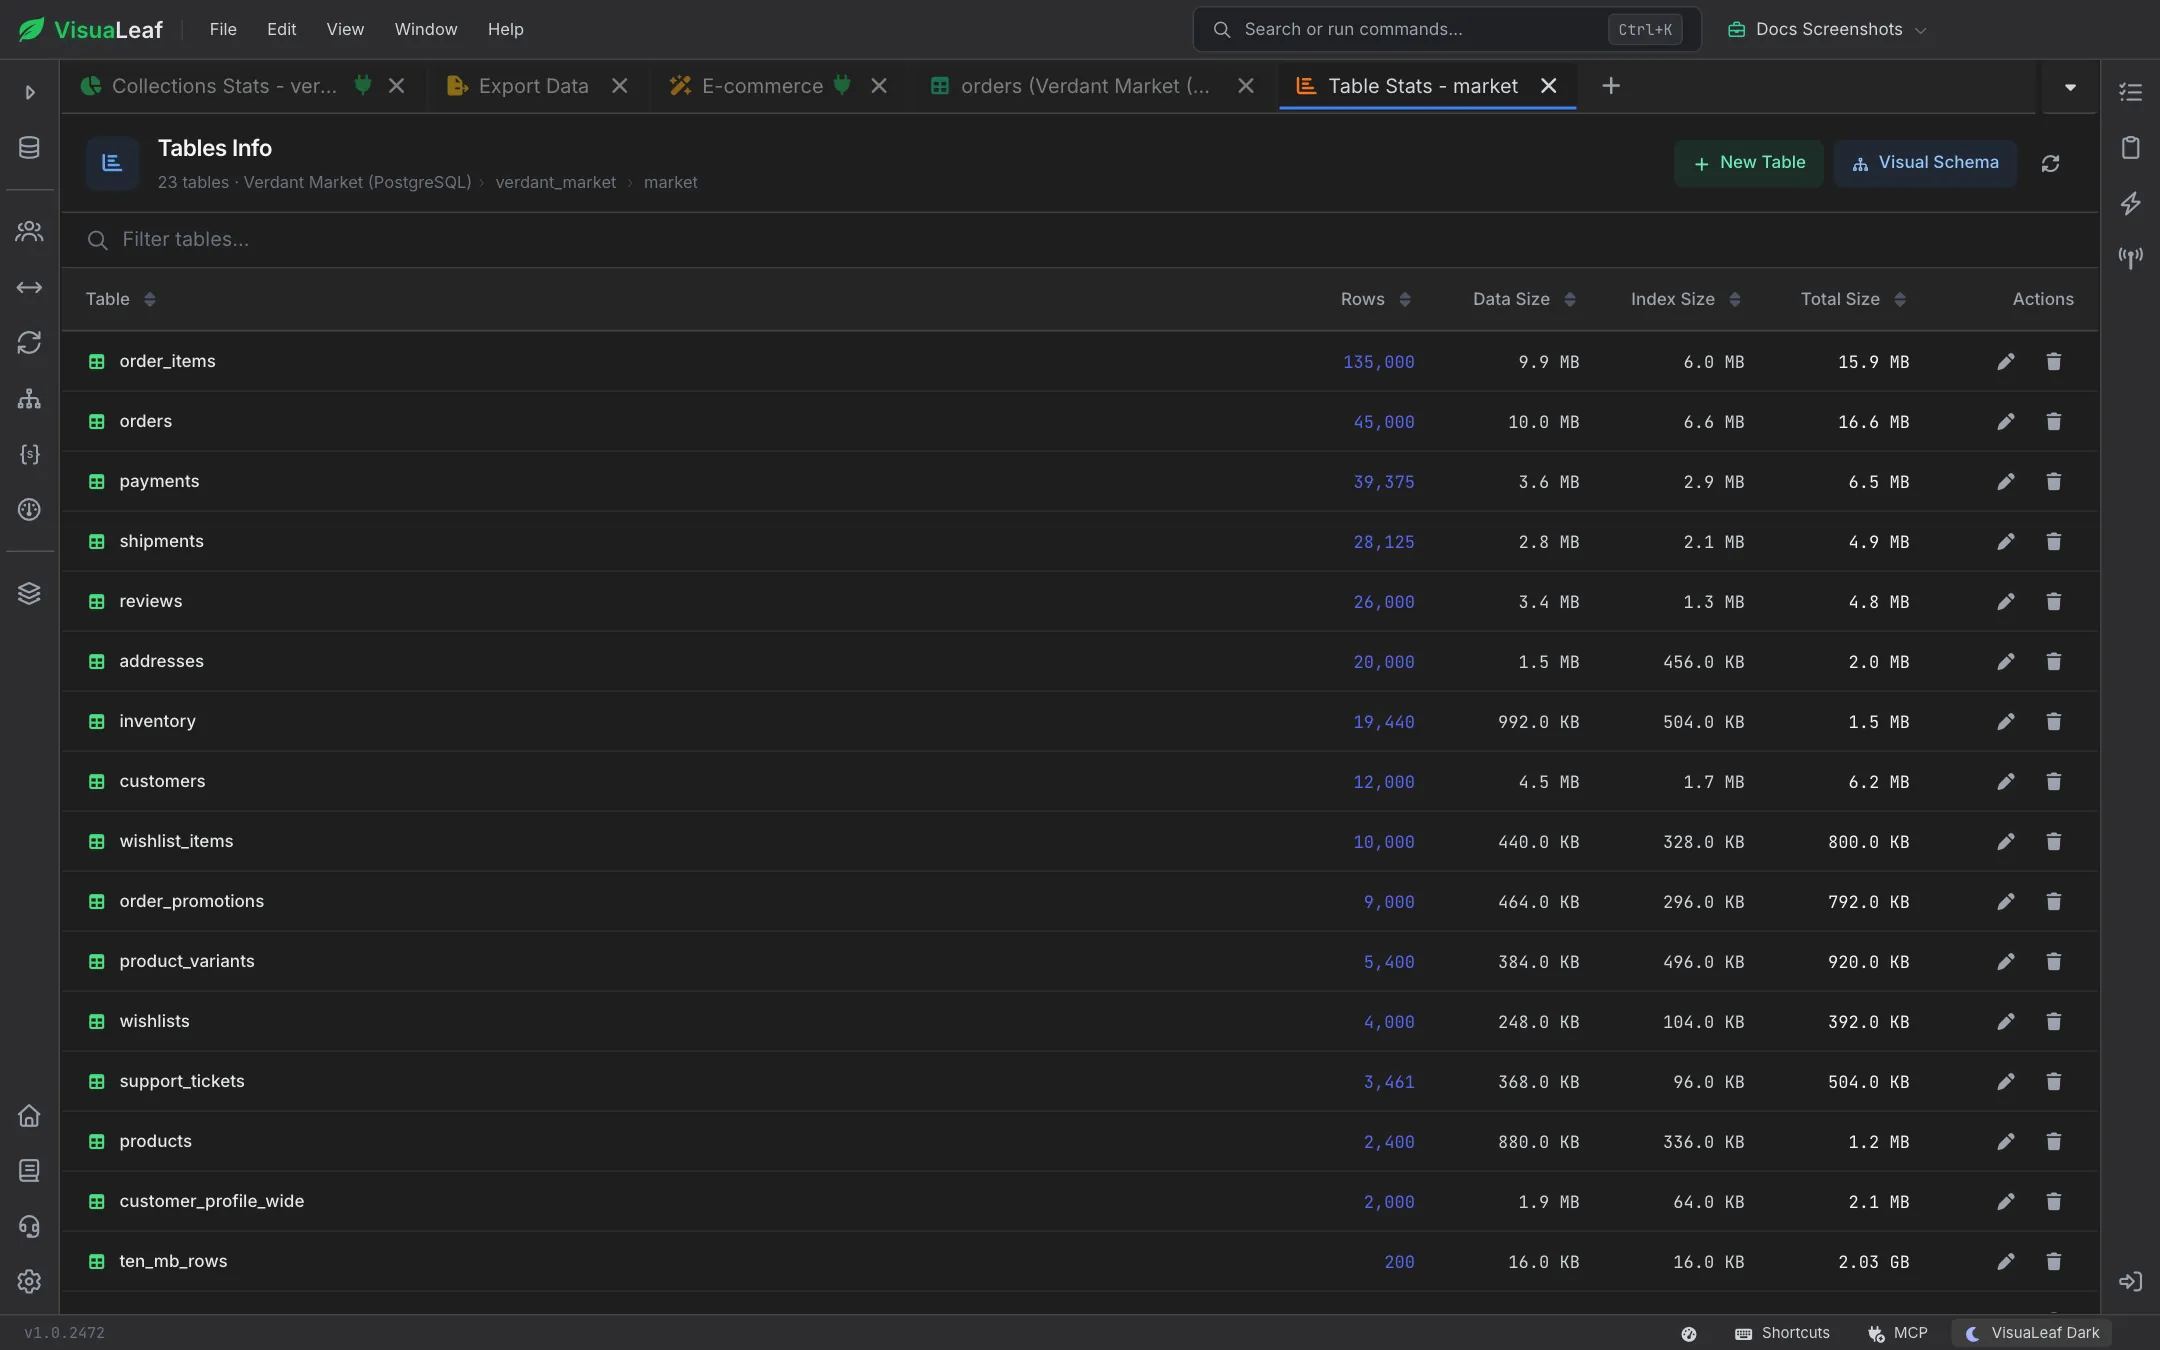
The Tables Info activity is a database-wide catalog of every table in the current database with its live storage footprint — row count, data size, index size, total size, and where the driver exposes them, the storage engine, current auto-increment value, and create/update timestamps. It's the go-to view for "what's in this database and how big is it" before drilling into a specific table.
Quick Start
- Open the Tables Info activity from a database's context menu, or right-click any table and choose Tables Info.
- The full table list loads in a single sortable grid. Click any column header to sort ascending, click again to flip the direction.
- Click a table name to open it in the SQL Table activity.
- Use the pencil to open Table Info for schema editing, or the trash to drop the table.
Beta
SQL support is in active development. Behavior around less-common dialects and very large databases may change.
Opening It
Open Tables Info from a database in the SQL connection sidebar. There is one activity per (connection, database) pair; the header shows how many tables there are and which connection, database, and schema you're looking at. Type in Filter tables… to narrow the list by name.
Columns
Every table in the database appears as one row. Columns are sortable by clicking their header; some columns are only shown when the driver reports the underlying value (typically MySQL/MariaDB for engine and auto-increment).
| Column | What it shows |
|---|---|
| Table | Table name. Clickable — opens the row's data in the SQL Table activity. |
| Rows | Row count as reported by the driver's catalog (usually the estimate, not an exact COUNT(*)). |
| Data Size | Row-storage bytes, human-formatted. |
| Index Size | Sum of all index bytes. |
| Total Size | Data + indexes. |
| Engine | Storage engine (MySQL/MariaDB — e.g. InnoDB). |
| Auto Inc | Current auto-increment value (MySQL/MariaDB). |
| Created / Updated | Timestamps from the driver's catalog where available. |
| Actions | Pencil to alter/manage schema, trash to drop. |
Toolbar
- New Table — opens the Create Table activity for this database.
- Visual Schema — opens the visual Schema Designer for the database.
- Refresh — reloads the list from the server.
Row Actions
- Click the table name — jumps to the SQL Table activity for that table.
- Pencil (Alter) — opens the Table Info activity where you can rename, add/change columns, edit indexes and foreign keys.
- Trash (Drop) — drops the table after confirmation.
Pro Tips
- Sort by Total Size descending as a first look at any unfamiliar database — the largest tables are almost always where the interesting operational risk lives.
- Rows column is an estimate. The driver returns a catalog-level row count that can drift on high-churn tables. Run
SELECT COUNT(*)in the SQL Editor if you need an exact number. - Refresh after DDL. Sizes and auto-increment values don't update live; hit Refresh after bulk inserts or DDL changes to see the new state.
Related Features
- SQL Table - Open the actual rows of any table listed here.
- Table Info - Alter columns, indexes, and constraints on a specific table.
- Create Table - DDL wizard for new tables.
- SQL Editor - Run an exact
COUNT(*)or investigate size details beyond the summary.
Ready to try VisuaLeaf?
Download and start managing your MongoDB and SQL databases with ease.
Download Free Trial