SQL System Monitor
SQL System Monitor
The SQL System Monitor is a live view over the server's own catalog of currently-running work — the queries in flight, the process list, and every server variable and status counter — polled straight from the server. No agent, no extra instrumentation. It's the tab you keep open in a second window while you're debugging why the app got slow five minutes ago.
Quick Start
- Open a SQL connection.
- Right-click the connection (or any database or table in it) and choose DB System Monitor / Server Info.
- The Current Queries tab loads with any query the server is running right now.
- Pick a refresh interval (default 2s) to stream updates — a green pulse in the toolbar confirms streaming is active.
- Switch to Processes, Variables, or Status for the wider picture.
Beta
SQL support is in active development. Behavior is validated against MySQL/MariaDB first; other dialects surface whatever their SHOW PROCESSLIST / SHOW VARIABLES / SHOW STATUS equivalents return, so column composition varies.
Opening the Monitor
The activity is scoped to a specific SQL connection — open it from the connection's action bar in the SQL sidebar. Every open connection gets its own tab.
The tab is titled DB System Monitor, with a Connected badge and a Refresh button. Three cards across the top show the full server version string, how long the server has been up, and the number of active connections. Each tab below carries a count of its rows.
Current Queries Tab
A live table of queries the server is currently running. Rows carry a status pill: Running (green pulse) for in-flight statements and Done (dimmed) for statements that have finished since the last render — so you can see something completing between polls instead of it just vanishing.
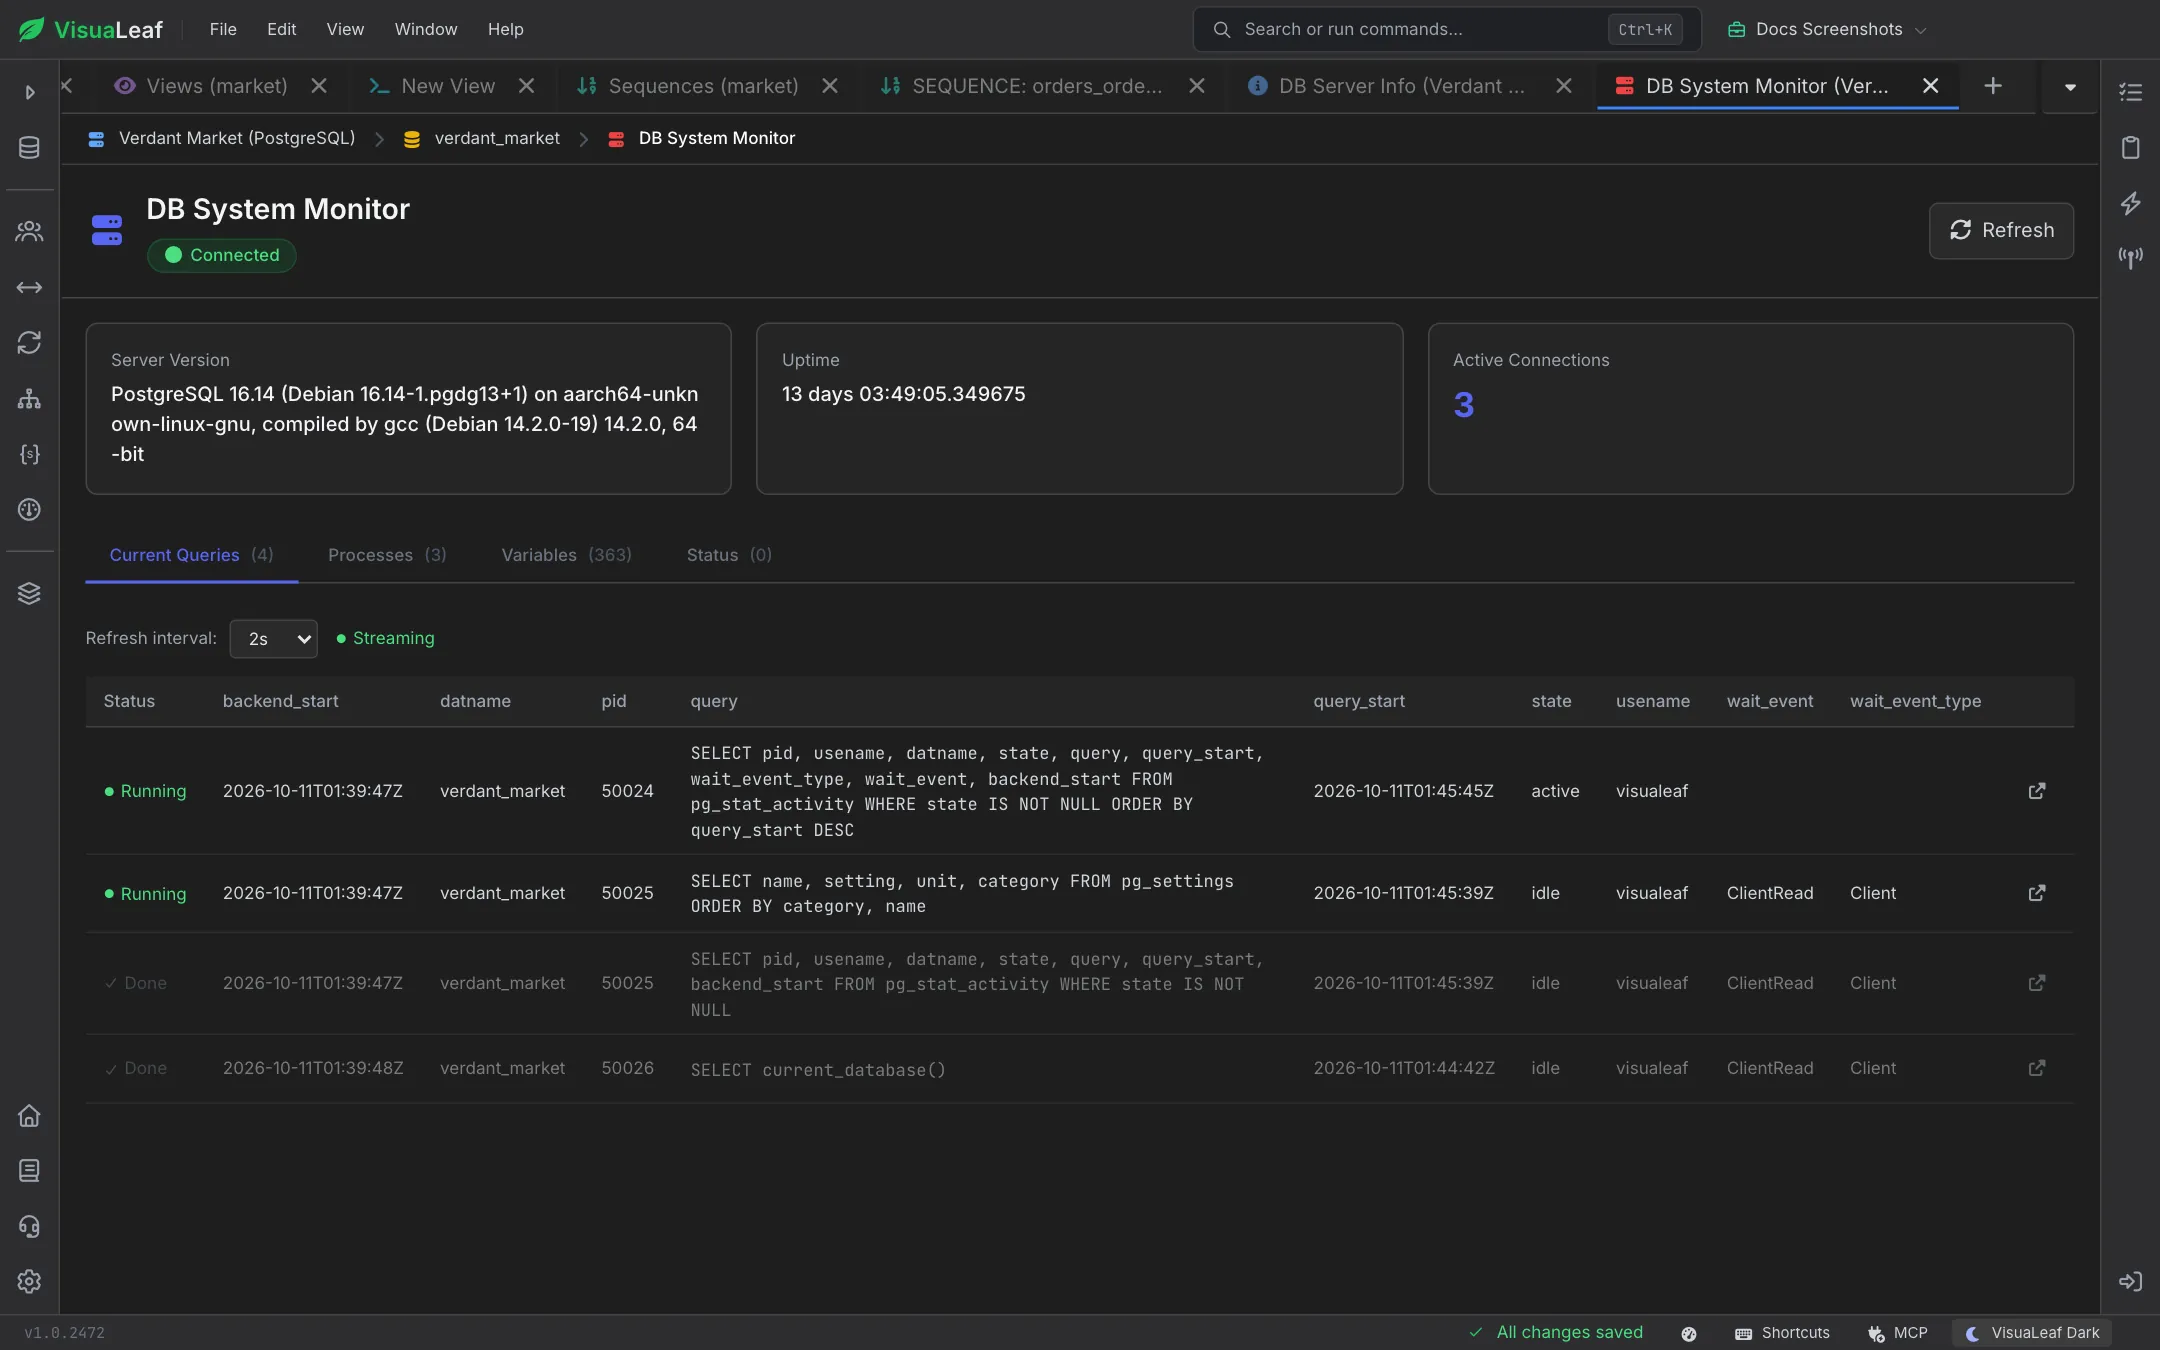
- Refresh interval selector —
Off,1s,2s,5s,10s,30s. Default is 2s. A green pulsing dot next to the selector reads "Streaming" while polling is active; pickingOffshows "Paused". - Columns — driver-provided (typically ID, User, Host, DB, Command, Time, State, Info/Query on MySQL). The
Info/querycell wraps and uses a monospace font so long statements stay readable. - Open in SQL Editor — every row with a captured query has an "open" icon that copies the query into a new SQL Editor tab, ready to
EXPLAINor edit.
Processes Tab
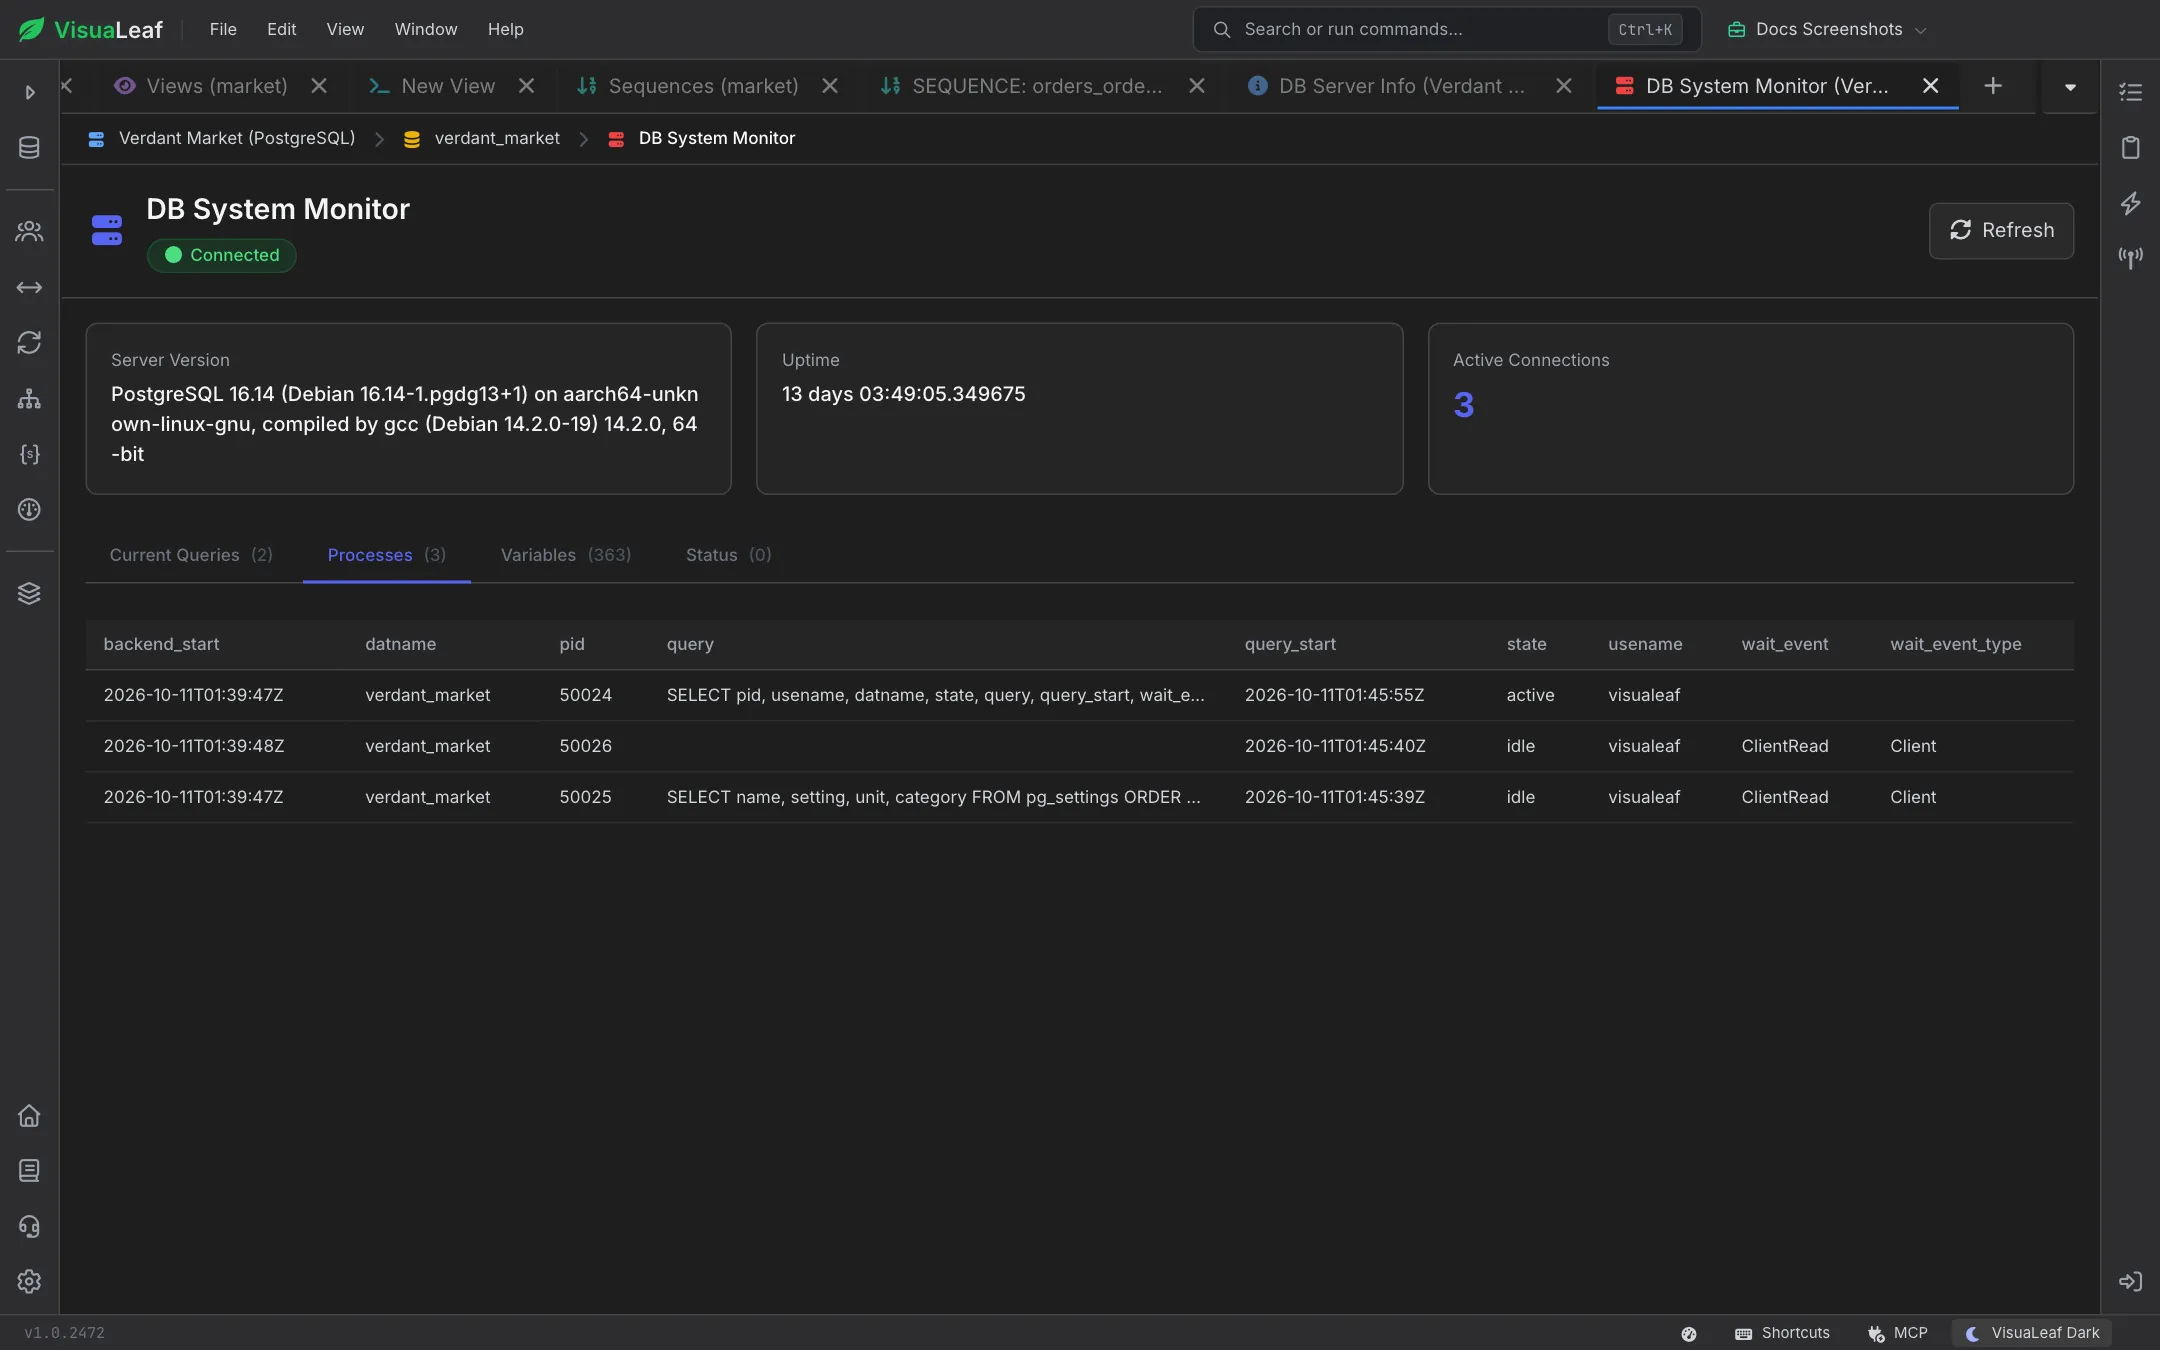
Full process list from the server (e.g. SHOW FULL PROCESSLIST on MySQL). This is a superset of Current Queries — includes idle sessions, replication connections, and workers not currently executing a statement — and the column set is whatever the driver returns.
Variables Tab
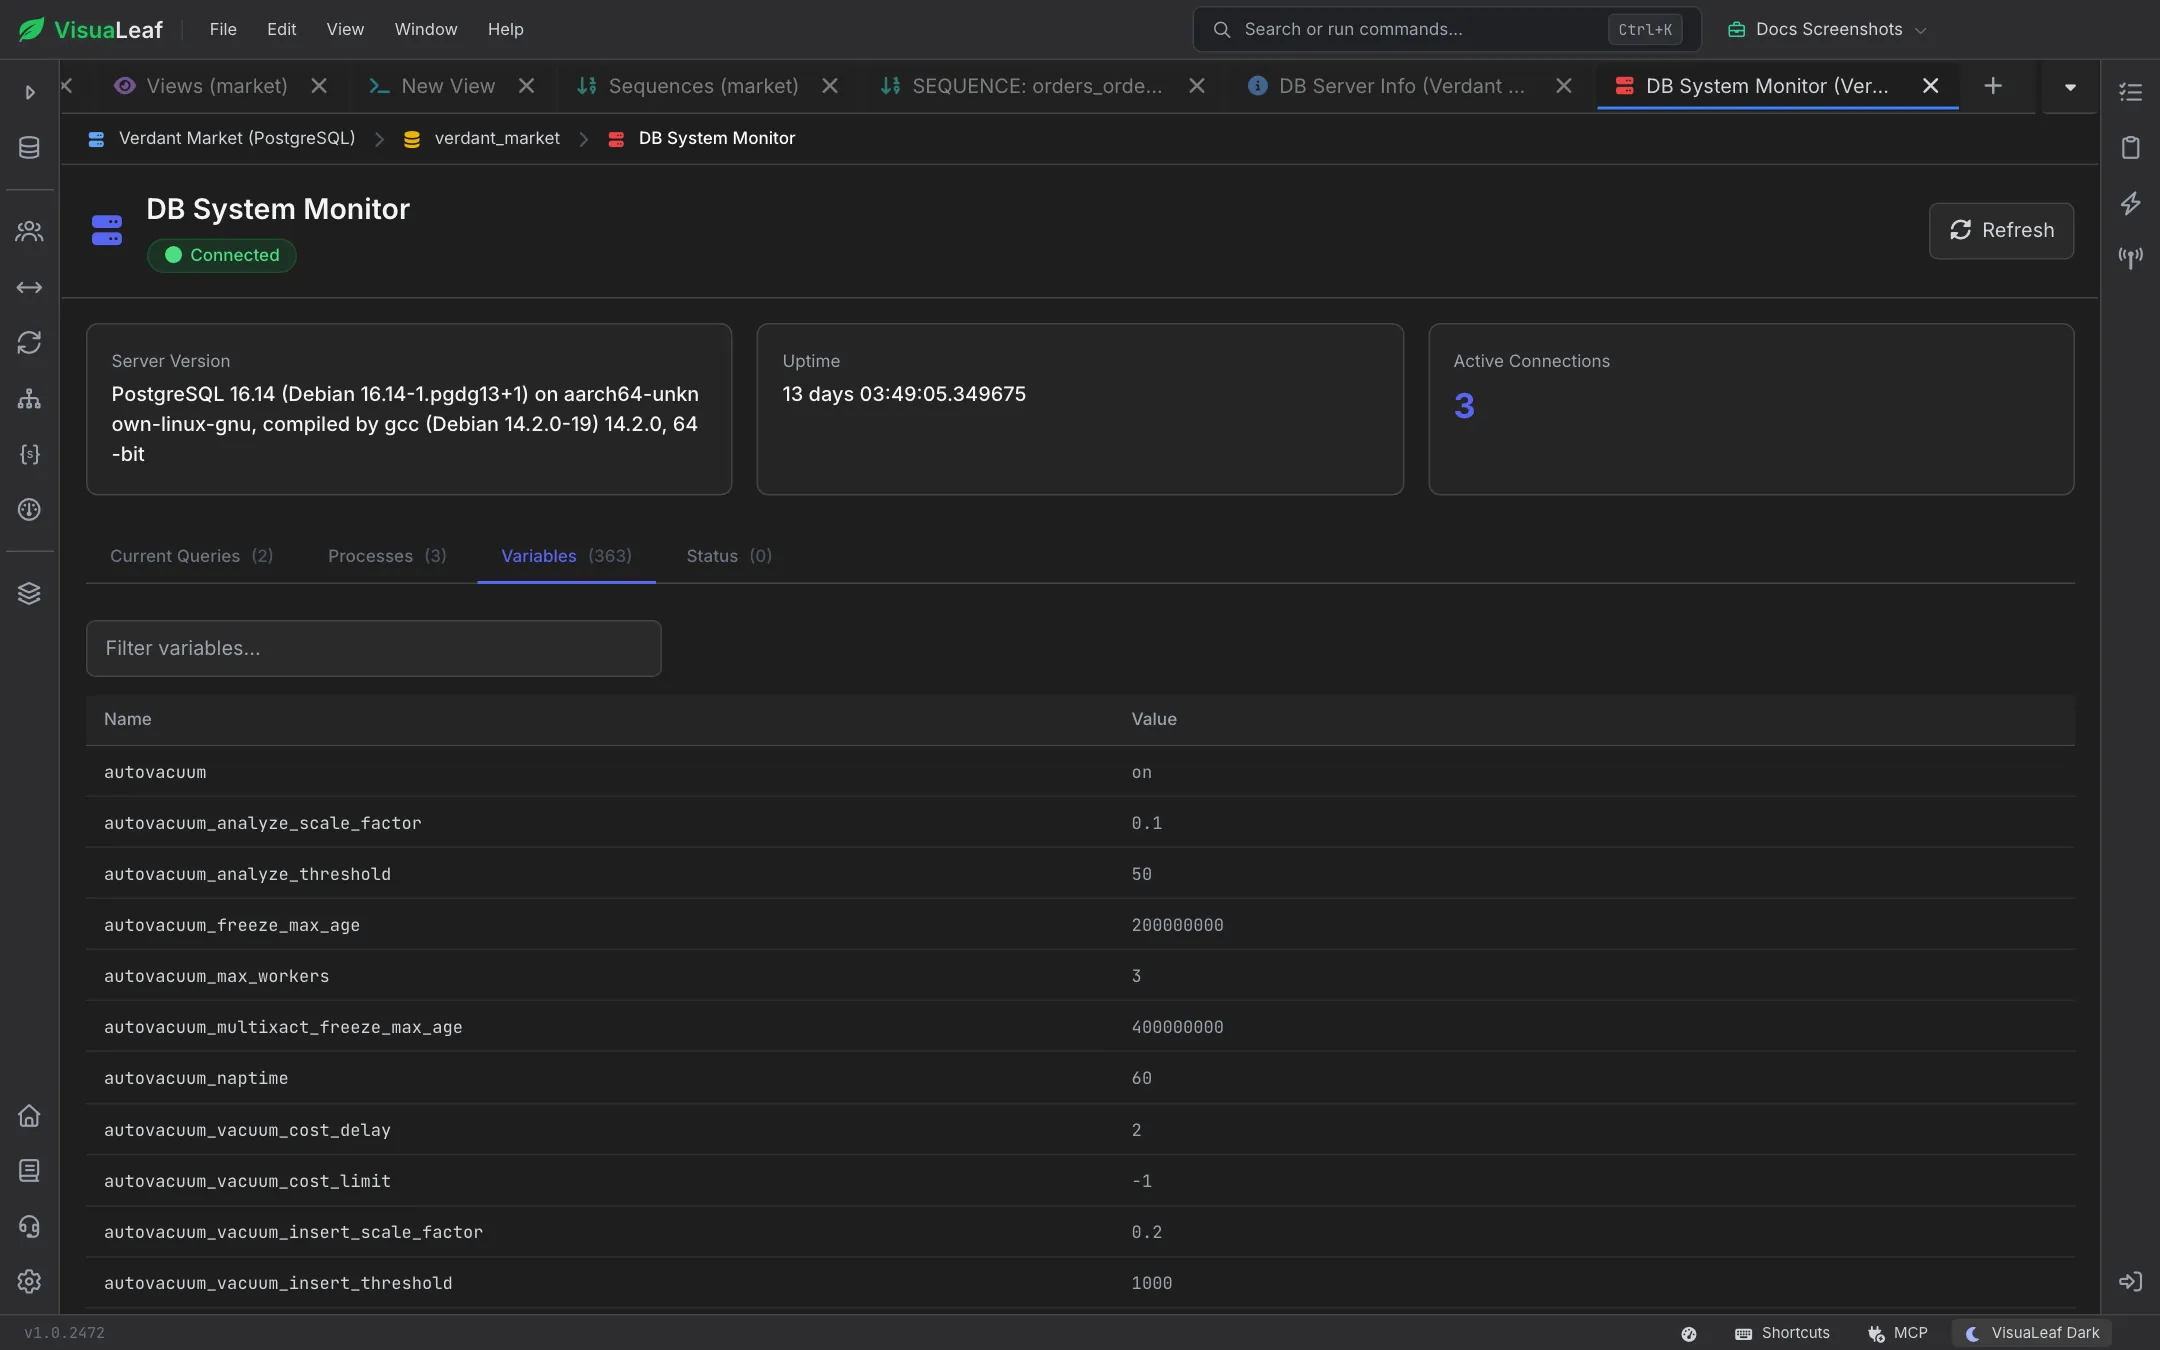
Every server variable (e.g. SHOW VARIABLES). A filter box at the top narrows the list by substring — handy when you're hunting for a specific tunable (innodb_buffer_pool_size, max_connections, etc.) without scrolling through hundreds of entries.
Status Tab
Server status counters (e.g. SHOW STATUS) — Threads_connected, Questions, Innodb_rows_read, and so on. Same filter box as the Variables tab.
Pro Tips
- Bump the interval to 5s or higher on busy servers. 1s or 2s is fine for local dev; on a production connection it means one
SHOW PROCESSLISTper second per open monitor tab. - Use the Info/query column as the funnel. Long-running rows that stay Running across several polls are the ones to open in the SQL Editor and
EXPLAIN. - Pair Current Queries with Query Profiling. The monitor shows what's running right now; the SQL Profiling activity shows a historical feed of slow queries the server has already captured.
- Bookmark specific variables. Filter the Variables tab to a single name and keep the tab open — it's the fastest way to spot a runtime config change.
Related Features
- SQL Profiling - Captured slow-query feed to complement the live view here.
- Server Build Info - Static server metadata (version, driver, per-database sizes) to complement the live counters.
- SQL Editor - Where the "Open in SQL Editor" action from the query row lands.
Ready to try VisuaLeaf?
Download and start managing your MongoDB and SQL databases with ease.
Download Free Trial