ClickHouse Database Management: Tables, SQL, and Schemas
Browse ClickHouse tables, inspect DDL, run analytical SQL, map logical relationships, create charts, and export data to Excel with VisuaLeaf.


ClickHouse is fast when the question involves scanning, grouping, and summarizing large amounts of data. The harder part is usually understanding the tables, data types, sorting keys, and logical relationships before you write the query, and, to be honest, ClickHouse has a few habits that aren't obvious if you're coming from Postgres or MySQL.
Using a ClickHouse GUI puts that work in one place. In VisuaLeaf, you can browse tables, inspect DDL, run analytical SQL, map logical relationships, create charts, and export the results.
What ClickHouse Actually Is
ClickHouse is a column-oriented SQL database built for analytical workloads. Because it stores values from the same column together instead of full rows, it can scan and aggregate huge datasets without reading data it doesn't need.
It's a strong fit for real-time analytics, observability, application events, and data warehousing, anywhere the pattern is "insert constantly, then summarize." Daily totals, revenue by category, event counts, time-series rollups. If your workload is mostly frequent row-by-row updates or relies on the database enforcing relationships between tables, a transactional database is still the better call: ClickHouse won't stop you from inserting an order with a customer ID that doesn't exist.
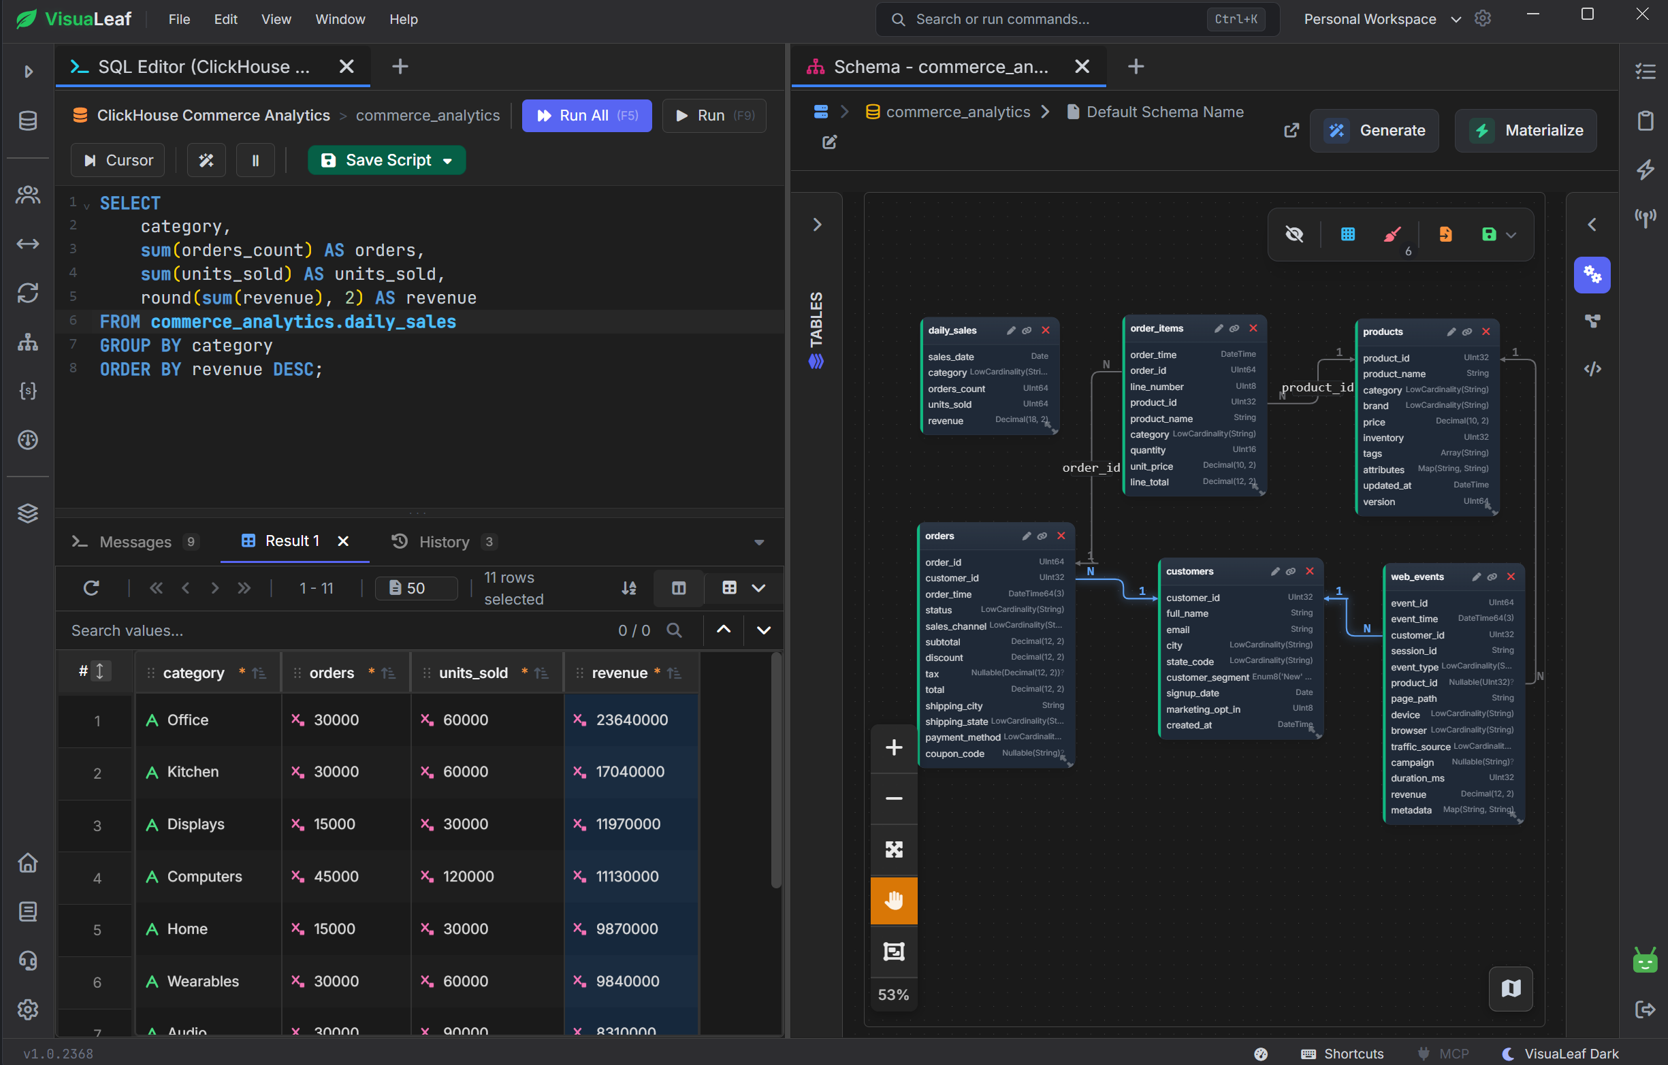
The database used in this article is commerce_analytics, with customers, orders, order_items, products, web_events, and a pre-aggregated daily_sales table.
Connecting VisuaLeaf to ClickHouse
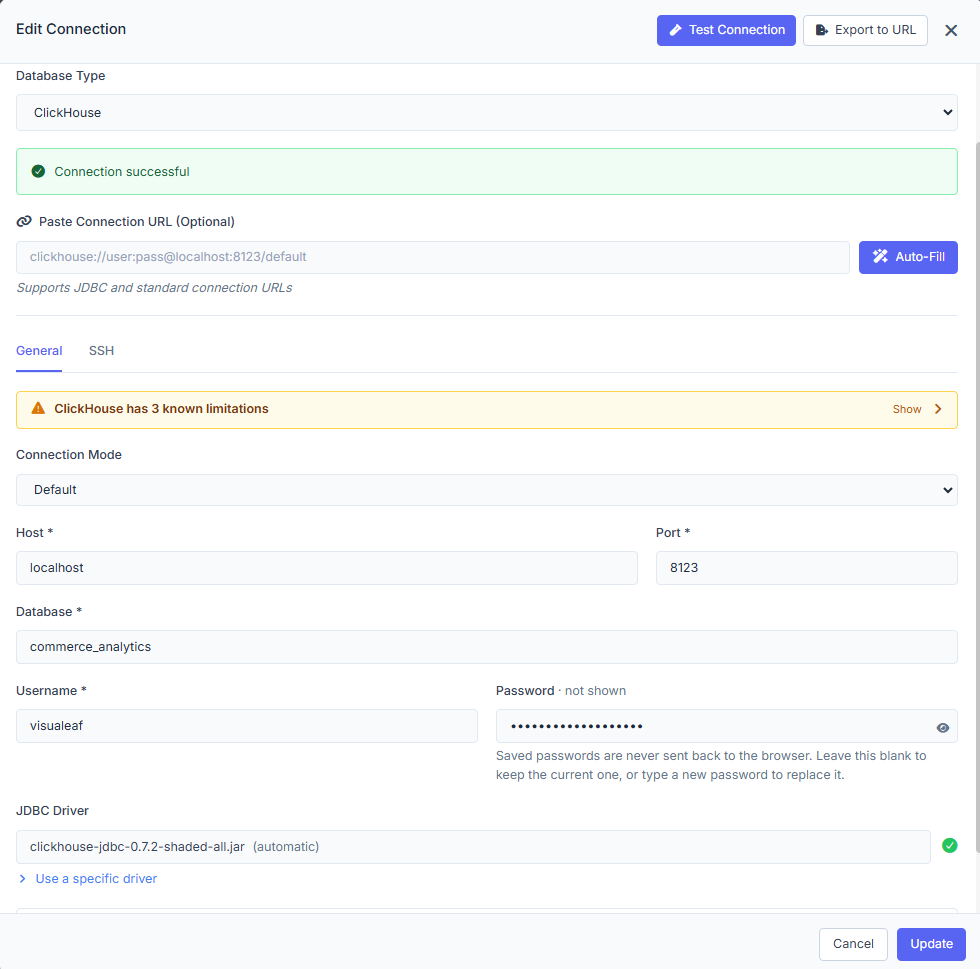
With ClickHouse running, create a new connection and enter:
- Host:
localhost - Port:
8123 - Database:
commerce_analytics - Username:
visualeaf - Password: your ClickHouse password
Test and save it, then open commerce_analytics from the sidebar.
This connection uses ClickHouse’s HTTP interface on port 8123. Port 9000 is reserved for the native protocol, so it will not work with this HTTP configuration.
Browsing Tables and Data Types
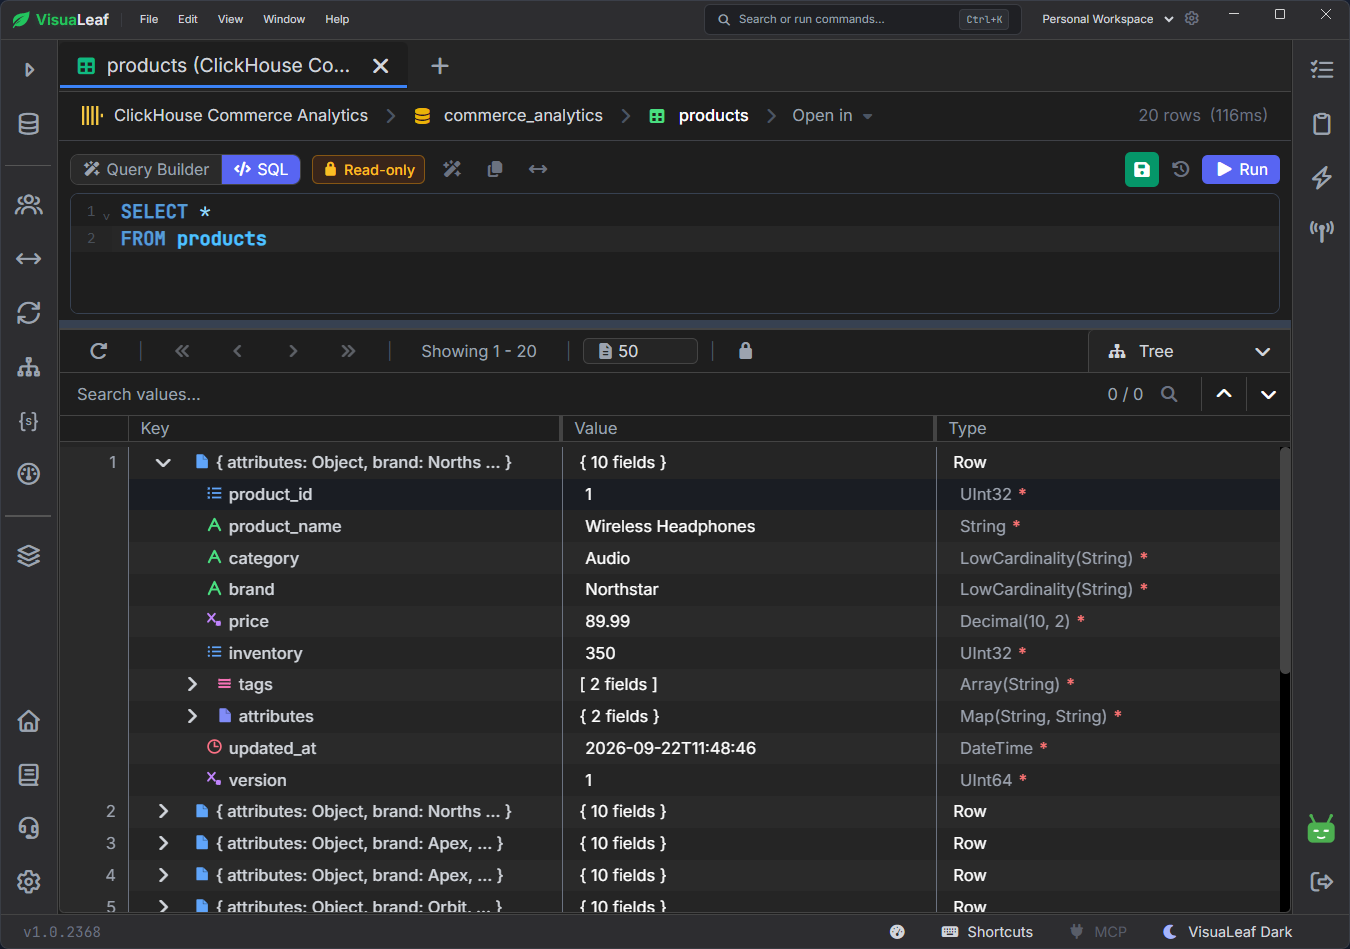
Opening a table in a grid lets you check values, filter rows, and get a feel for the data before writing anything bigger.
The products table uses several types that show up constantly in ClickHouse schemas and rarely elsewhere:
UInt32for identifiers and inventory countsDecimal(10,2)for pricesLowCardinality(String)for repeated values like category and brandArray(String)for product tagsMap(String, String)for flexible product attributesDateTimefor the last update time
LowCardinality(String) stores a small set of repeated labels through dictionary encoding -> it's a performance optimization, not a different data type conceptually, so it still behaves like a string in queries. Arrays and maps keep related values together without spinning up another table just to hold tags or attributes.
web_events combines time, customer and product identifiers, page path, device, source, duration, revenue, and a metadata map. Look at a handful of rows before writing an aggregation, it's the fastest way to catch that product_id is nullable (not every event is tied to a product) before it silently drops rows out of a join later.
LowCardinality, Array, and Map columns.Inspecting and Managing a Table
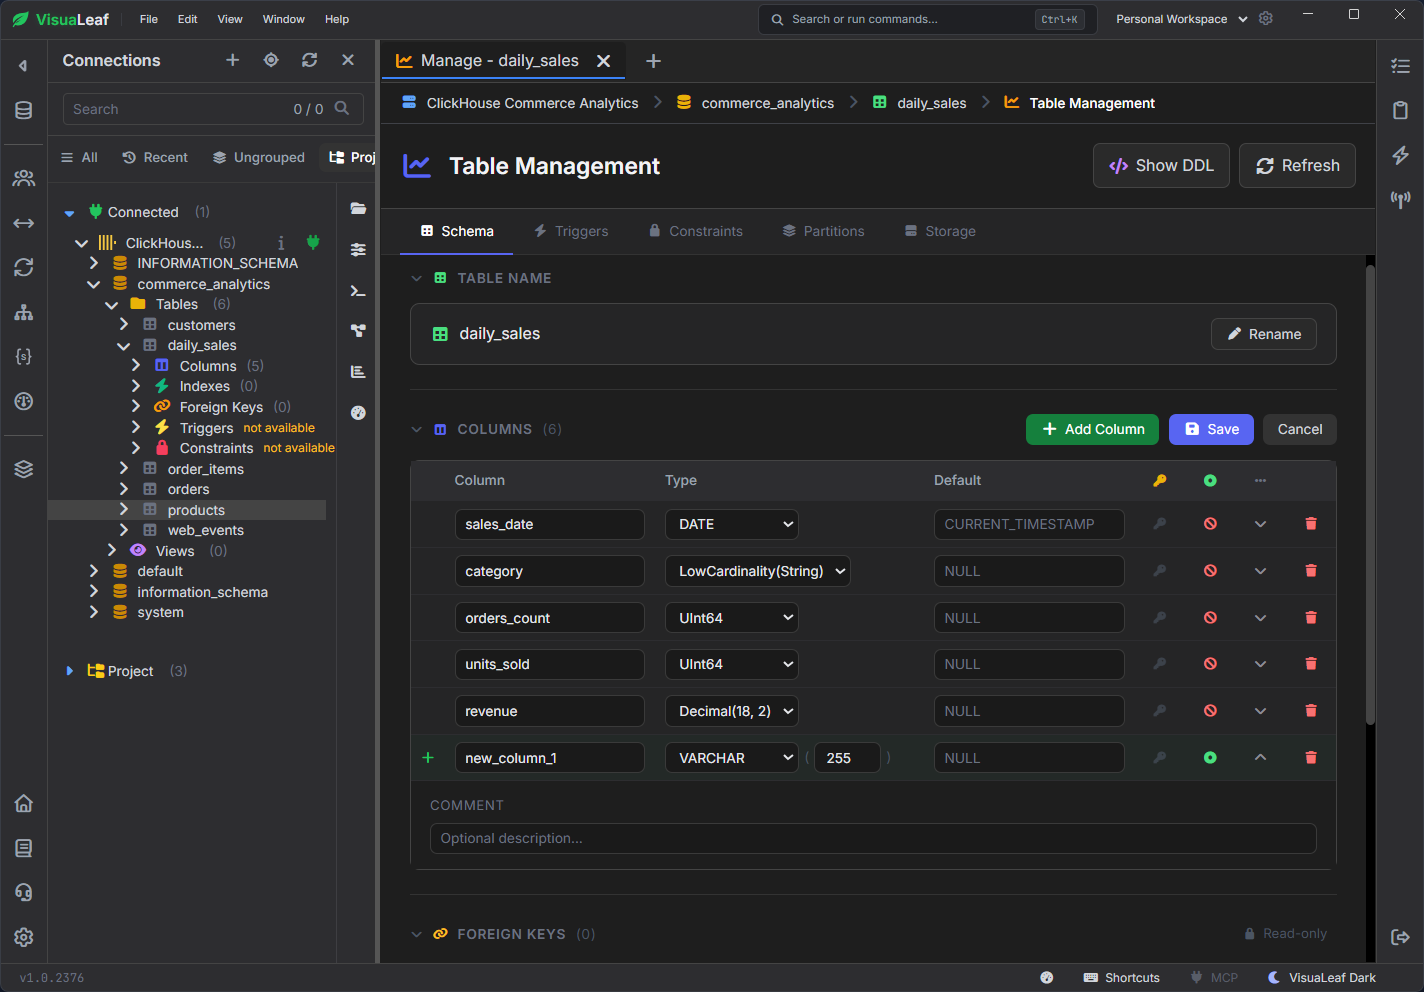
Before changing a table, look at how it was actually defined. In ClickHouse, the engine and sorting key matter more than they would in most databases, because they determine how data is physically stored and how fast a query against it will be.
VisuaLeaf's Table Management view lists column types, nullability, defaults, keys, and indexes, with storage and partition details separated. That's easier to read than a wide CREATE TABLE statement, especially on a table you didn't build.
daily_sales has five columns visible in one place here. Where the table's engine supports a structural change, you can make it from this view instead of writing the ALTER TABLE by hand.
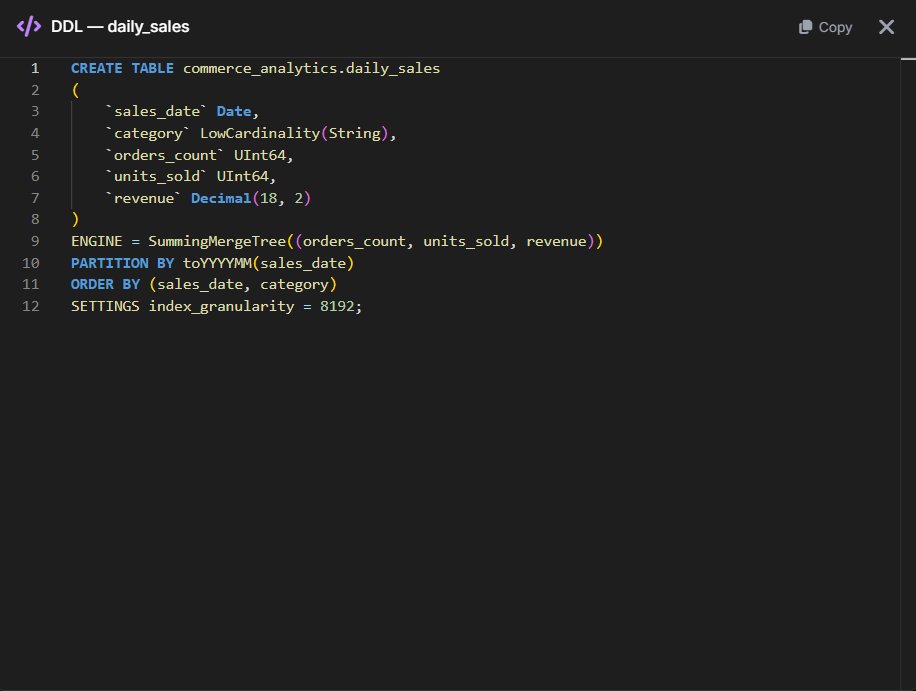
daily_Salestable.The DDL shows the parts of the table definition that matter most in ClickHouse. daily_sales uses SummingMergeTree, is partitioned by month, and is sorted by (sales_date, category).
There is no separate PRIMARY KEY in this definition. In that case, ClickHouse uses the ORDER BY expression as the primary key for its sparse index. It helps ClickHouse find and skip data efficiently, but it does not enforce uniqueness as a primary key would in Postgres or MySQL. More than one row can have the same sales_date and category.
Because this table uses SummingMergeTree, ClickHouse can combine matching rows and sum orders_count, units_sold, and revenue during background merges. Those merges do not happen immediately, which is why the analytical query still uses sum() and GROUP BY to return accurate totals.
The ClickHouse data-modeling guide explains these differences in more detail.
daily_sales table.Running an Analytical Query
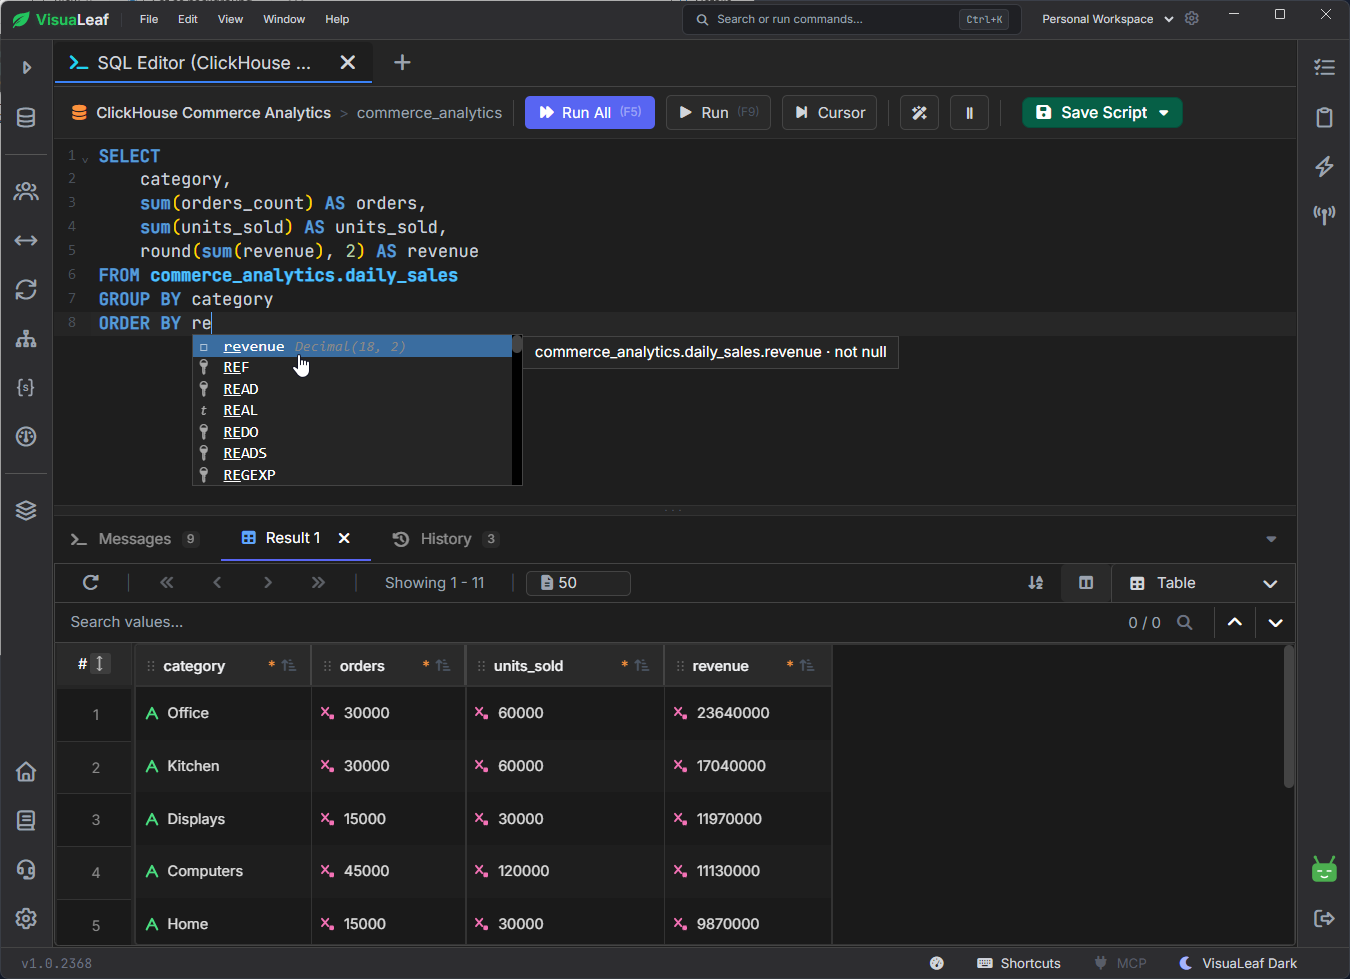
With the structure clear, the SQL editor answers the actual question. This groups daily_sales by category and totals orders, units sold, and revenue:
SELECT
    sales_date,
    category,
    round(sum(revenue), 2) AS revenue
FROM commerce_analytics.daily_sales
GROUP BY sales_date, category
ORDER BY category, sales_date;
This is the exact shape of workload ClickHouse is built for: read only the columns you need, aggregate across a lot of rows, group, return a compact result.
On a small table like this, it runs instantly. On a larger one, skip SELECT * and filter early, because ClickHouse reads column by column; pulling columns you don't need costs real time on a wide table, but not on a narrow one.
Charts from ClickHouse Query Results
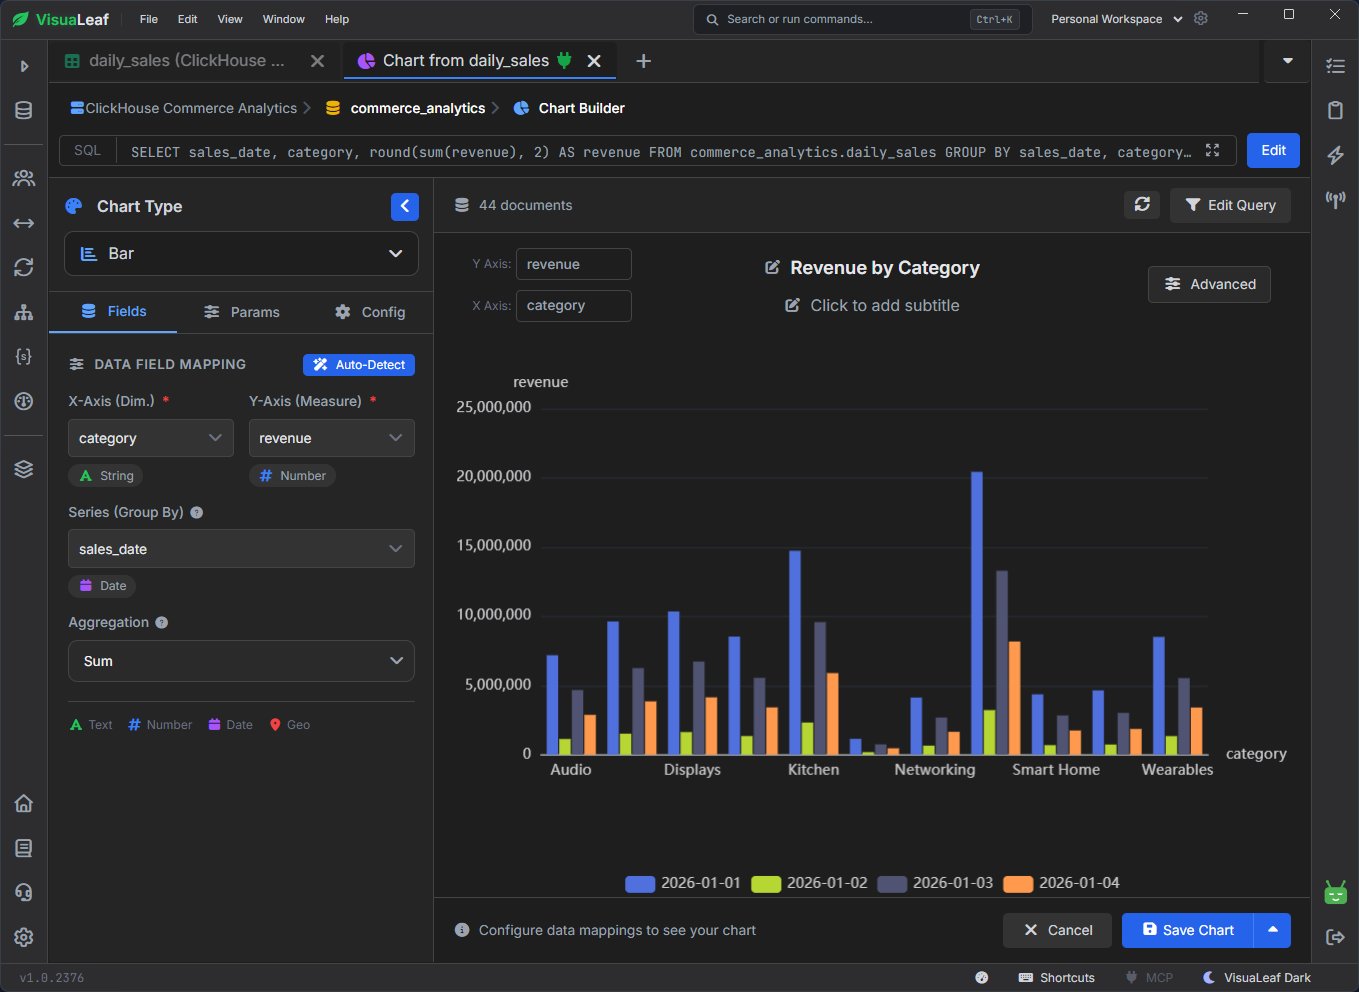
The result grid gives you the exact totals. The chart makes the difference between categories much easier to see. The same daily_sales data can be opened in Chart Builder, with category along the X-axis and revenue on the Y-axis.
Adding sales_date as a series gives each reporting date its own color. This makes it possible to compare revenue across categories while also seeing how the numbers changed between dates. For a longer date range, grouping by week or month would keep the chart readable.
The grid is still better when you need exact values. The chart is useful when you want to see which categories stand out before looking more closely at the numbers.
Visualizing Tables and Relationships
You can diagram a ClickHouse schema, but read it differently than you'd read a Postgres ER diagram.
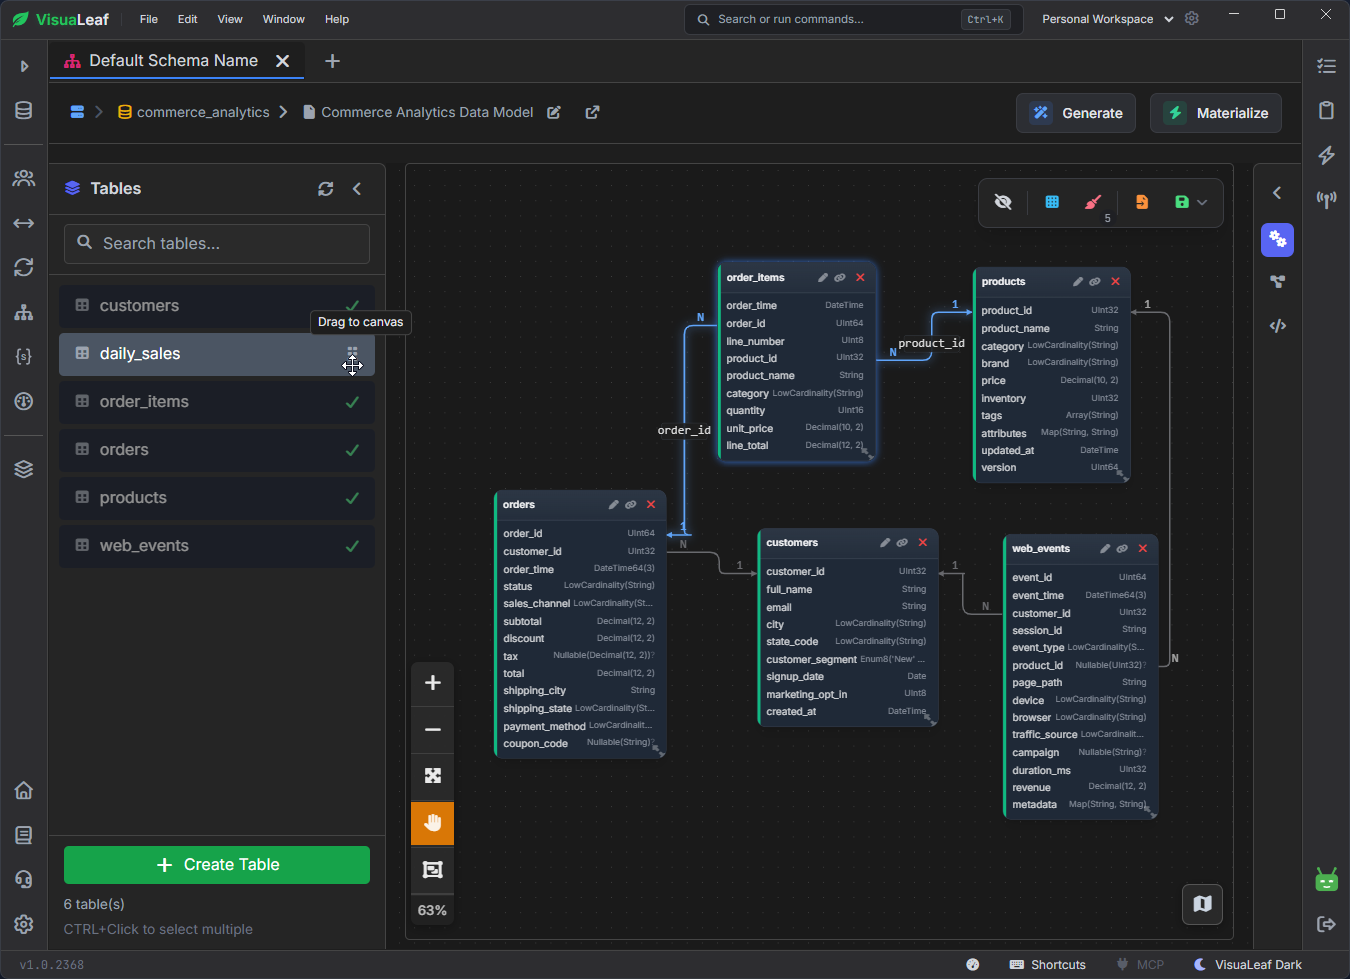
The logical path here is:
customers → orders → order_items → products
web_events connects to customers and products through customer_id and product_id. daily_sales sits outside that path entirely, it holds pre-aggregated totals, not individual order rows, so it doesn't join into the rest of the model the same way.
Here's the part that actually matters: the diagram will show these connections, but the sidebar still shows Foreign Keys: 0 because these lines are logical relationships, not constraints stored or enforced by ClickHouse.
Nothing stops a order_items row from referencing an order_id that doesn't exist in orders. The diagram documents your model; it doesn't validate it.
If you're used to a database that would reject that insert, this is the one place ClickHouse's behavior will surprise you.
Exporting to Excel
For review or reporting, pick a ClickHouse table as the source and export straight to Excel, or another format if you want. This job used:
- Job name:
Export Daily Sales to Excel - Source:
commerce_analytics.daily_sales - Target: Excel Workbook
- File:
daily_sales.xlsx
Run it once with Export Now, or save it as a job you can rerun without reconfiguring anything.
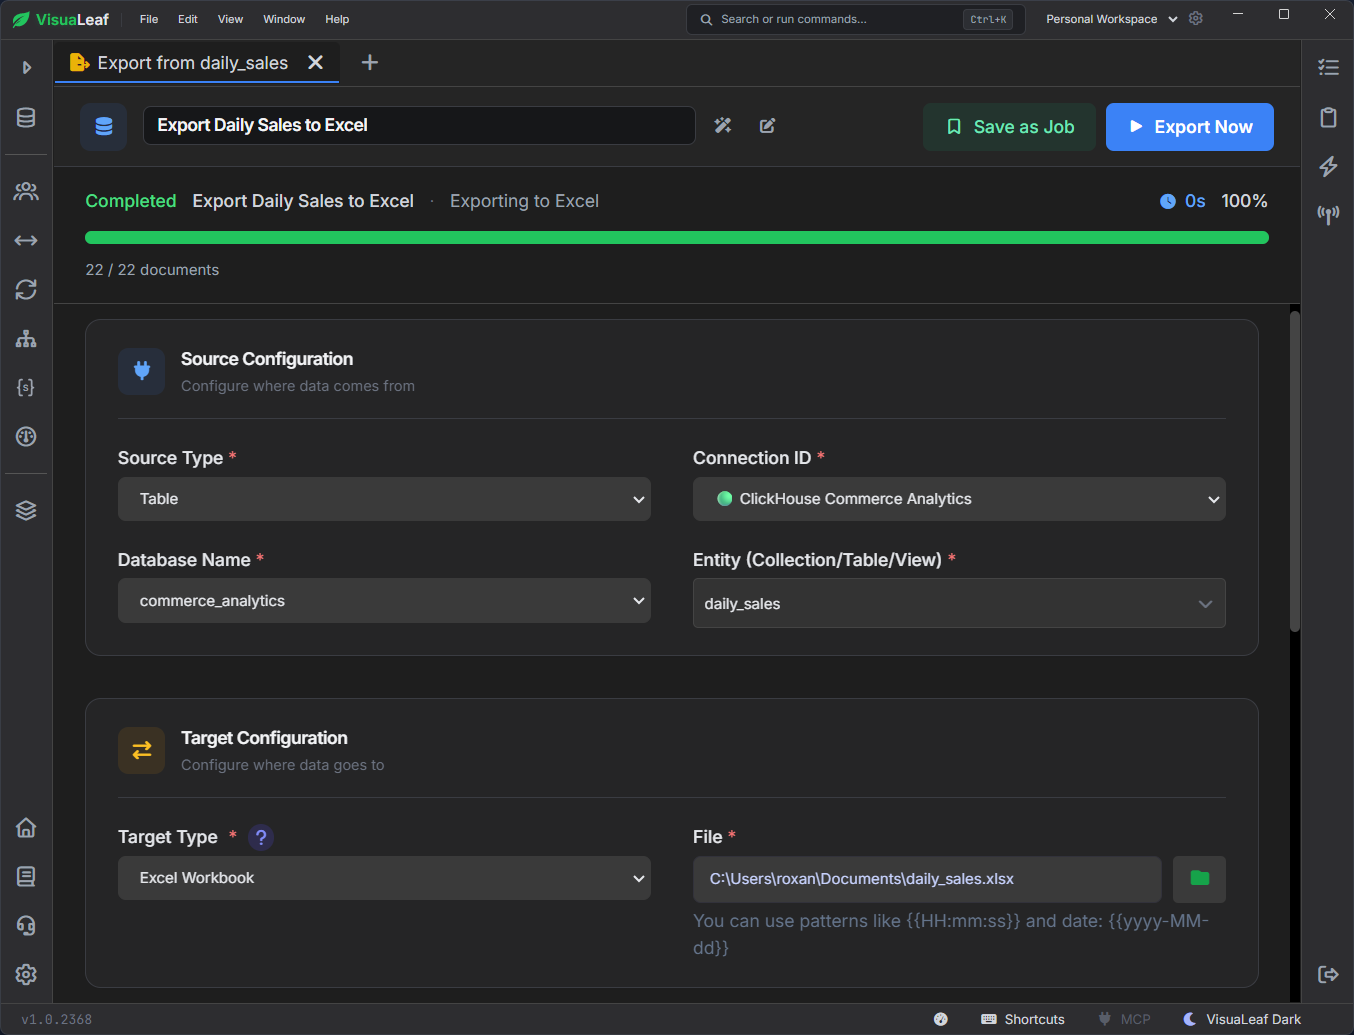
daily_sales table to an Excel workbook.CLI or GUI?
The CLI is still the right tool for quick checks, scripts, and container administration; you're not opening a GUI inside automation. A GUI earns its place when you're exploring a schema you didn't build: checking types before you write a query, reading table definitions, keeping relationships documented, setting up exports you'll run again. Both get used together here -> ClickHouse itself ran in Docker; VisuaLeaf was for everything that involved actually understanding the data.
Want to try this with your own ClickHouse database? Download VisuaLeaf and connect to your server.