How to Use Databricks SQL With VisuaLeaf
See how a Databricks SQL warehouse fits into your workflow and where a desktop client helps with staging checks, schema exploration, and chart review.


Databricks is a cloud platform teams use to prepare and analyze data. I connected VisuaLeaf to Databricks to run SQL, find the columns I needed for a join, and compare two versions of a table to see which rows had changed.
What is Databricks used for?
A retailer can use Databricks to combine orders from its application database with tracking events from shipping carriers. Data engineers build the pipeline that turns those feeds into tables. Analysts can then use SQL to find late shipments, and data scientists can use the same data to train models.
How Databricks SQL runs a query
A SQL warehouse runs your query and reads the table data from cloud storage. Unity Catalog organizes tables into catalogs and schemas and controls who can access them. When you write SQL in VisuaLeaf, it sends the query to the warehouse and displays the results.

A full table name follows the pattern catalog.schema.table, as in workspace.fulfillment_demo.shipments. Use all three parts when staging and production have tables with the same name.
Connect VisuaLeaf to a SQL warehouse
In Databricks, go to SQL Warehouses, open your warehouse, and copy the Server hostname and HTTP Path from Connection details. The hostname identifies the workspace. The HTTP path selects the warehouse.
Create a Databricks connection in VisuaLeaf with these settings:
| Field | What to enter |
|---|---|
| Connection Mode | SQL Warehouse |
| Host | The server hostname from Databricks |
| Port | 443 |
| HTTP Path | The warehouse path beginning with /sql/1.0/warehouses/ |
| Catalog | Optional. I used workspace for the demo. |
| Sign-in method | I used a personal access token. Use the method your workspace allows and your client supports. |
For a token-based connection, go to Settings → Developer → Access tokens → Manage in Databricks and generate a token. Enter it in the Personal access token field in VisuaLeaf.
Click Test Connection, then Save and connect. In the build I tested, JDBC URL Auto-Fill put the HTTP path in Catalog. If you see that, switch back to SQL Warehouse mode, clear the JDBC parameters from Catalog, and enter the fields manually.
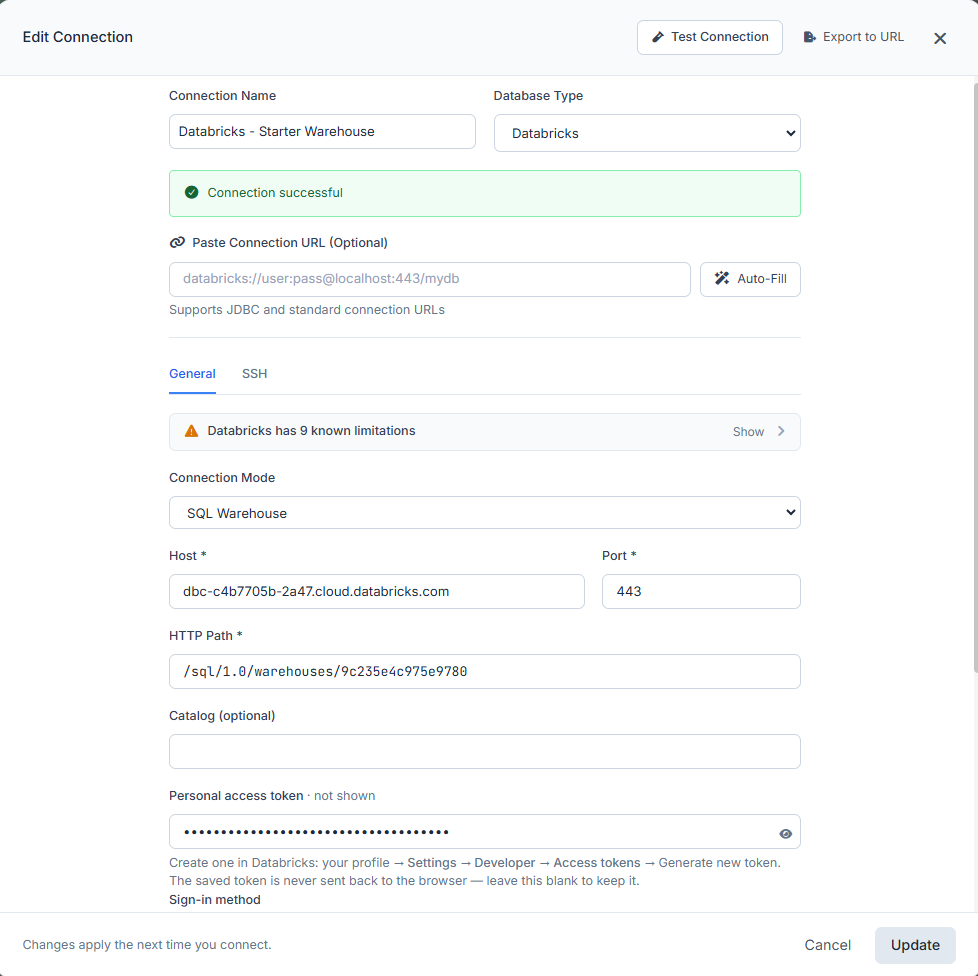
Once you connect, run this to see the catalog and schema your session starts in.
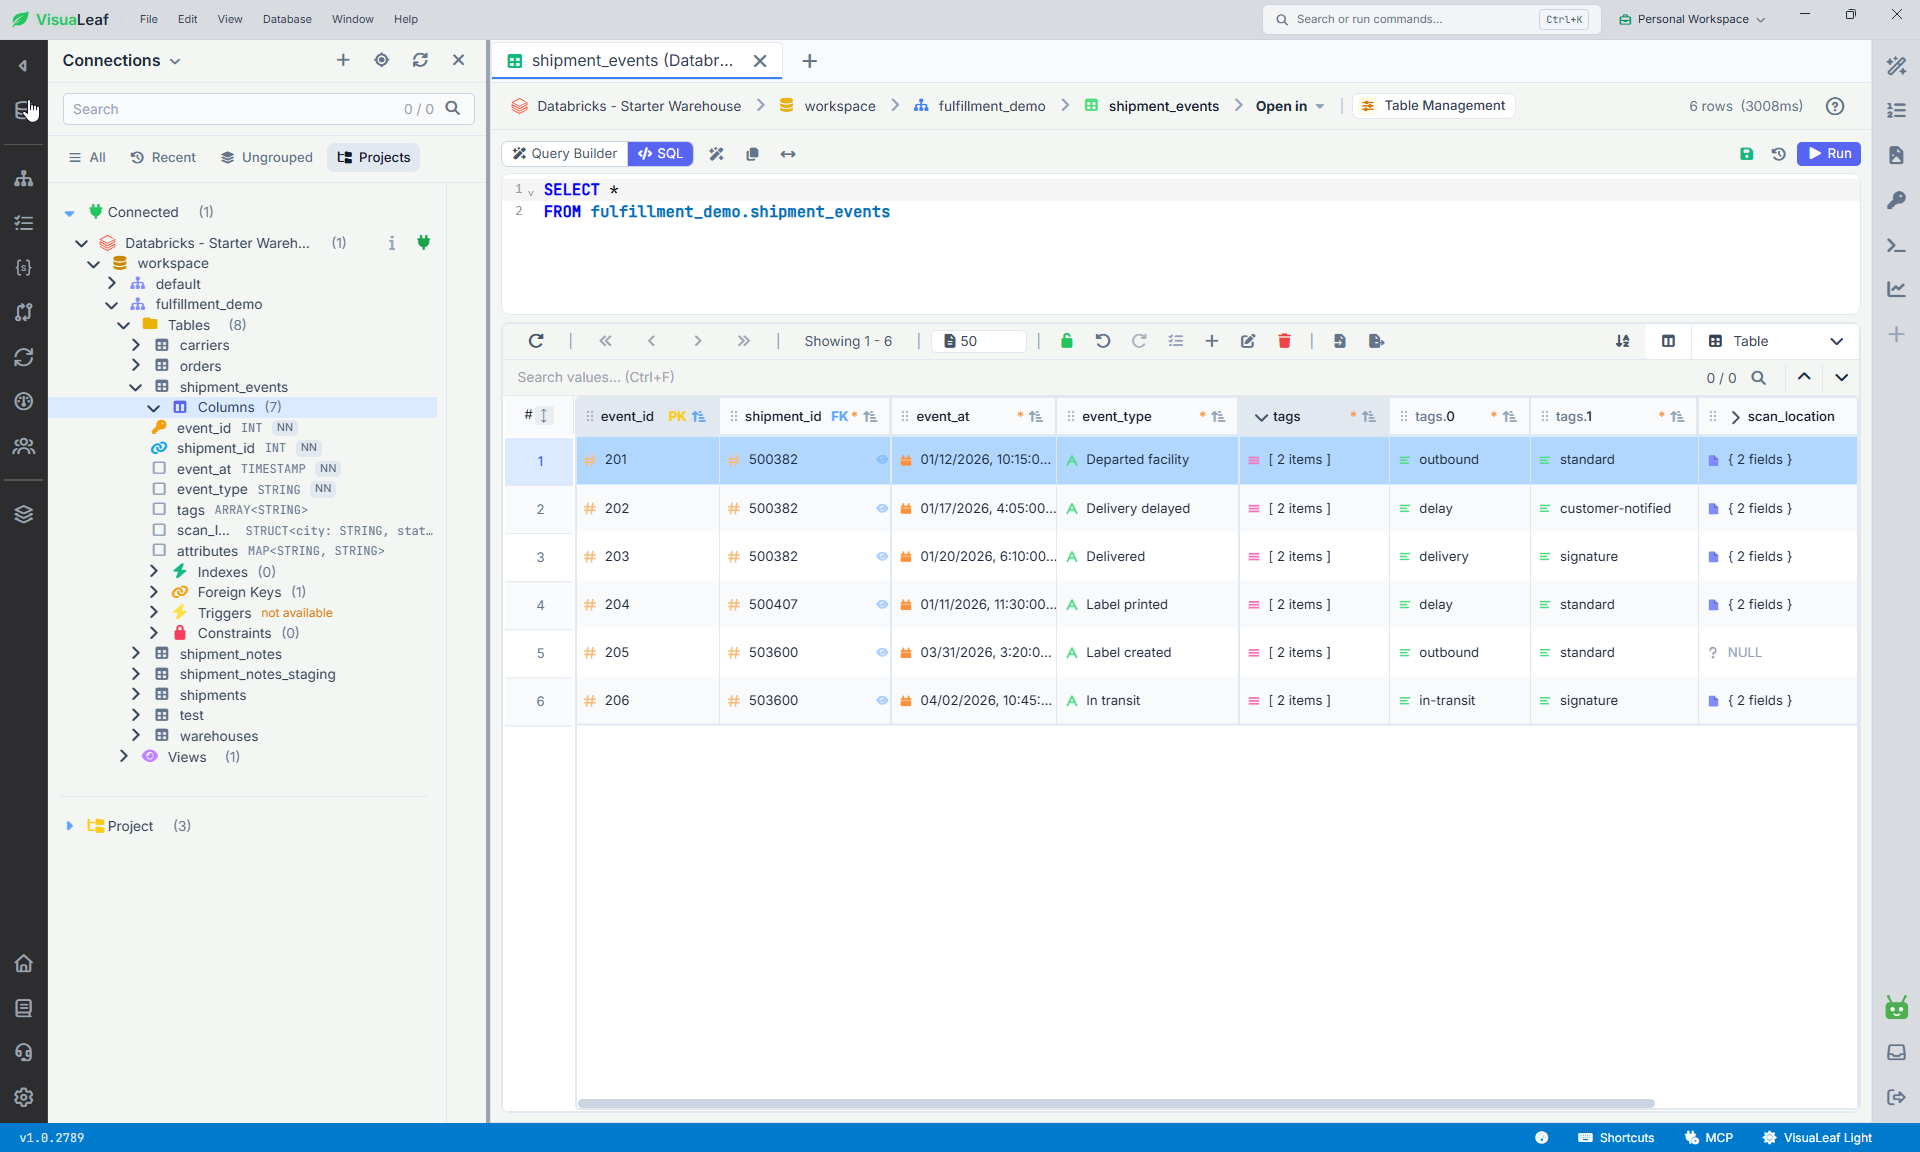
SELECT current_catalog(), current_schema();I opened shipment_events to check what its nested columns looked like in the table browser. Expanding a struct showed the individual fields without having to write a new query. If your connection works and a table query fails, check the three-part name and your Unity Catalog grants.
What I used VisuaLeaf for
Compare a source table with staging
In Data Compare, I paired shipment_notes with shipment_notes_staging and matched rows on note_id. The Structure tab flagged a separate difference. The source declares a foreign key from shipment_id to shipments.shipment_id. The staging table leaves it out.
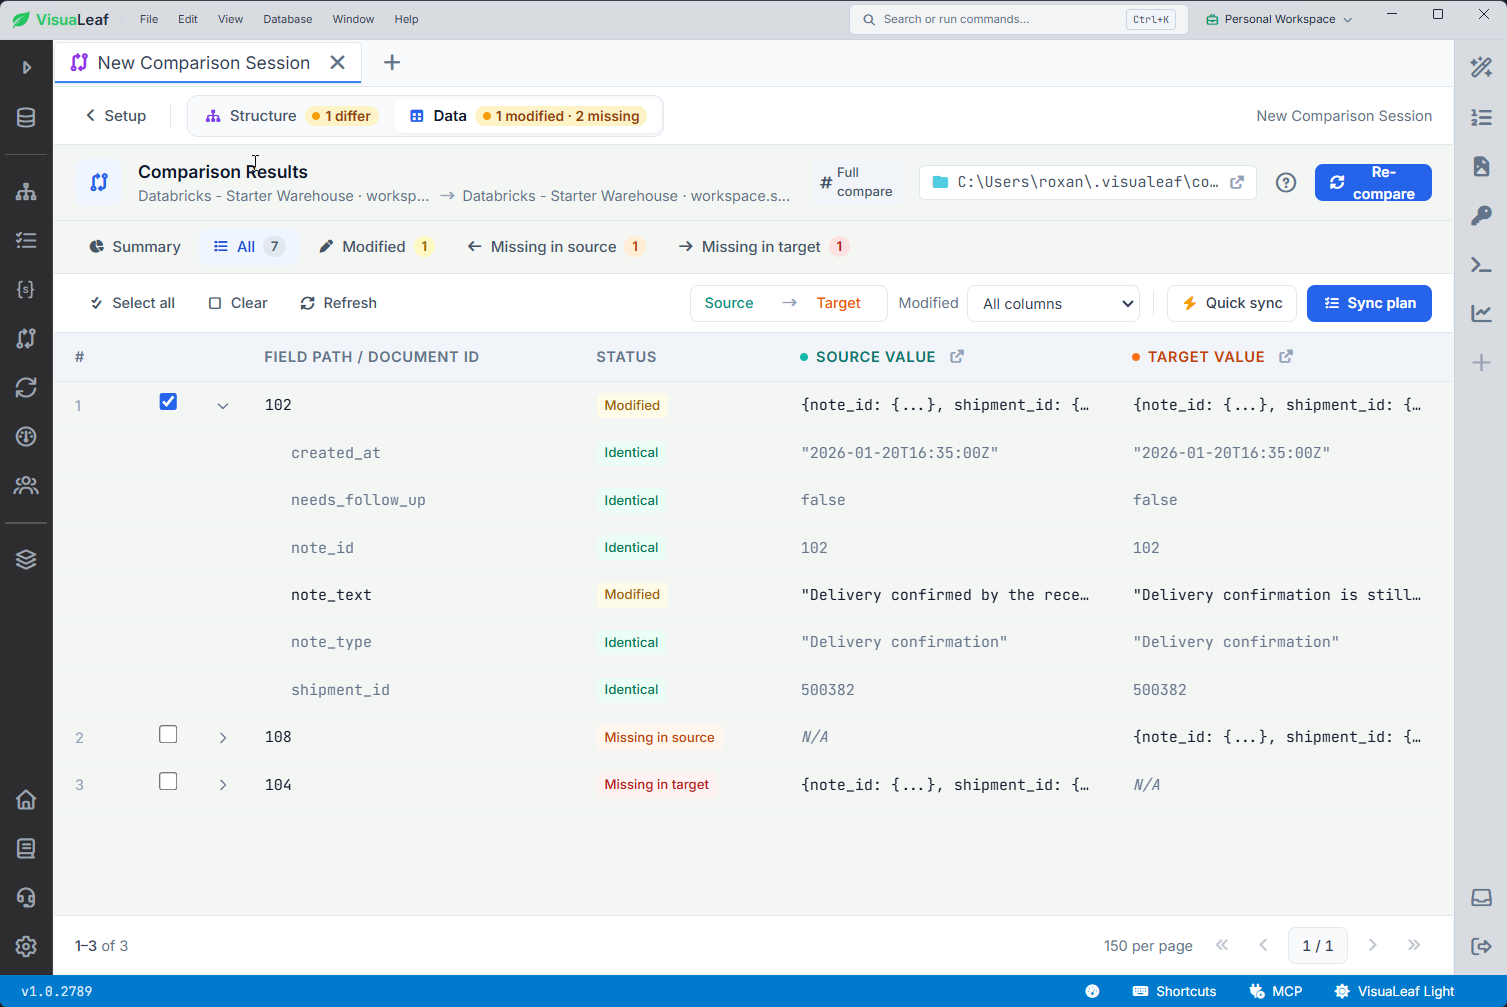
note_id as the match key so the comparison pairs the same note across both tables.Check that the match key is unique on both sides. Databricks treats primary and foreign keys on these Unity Catalog Delta tables as informational, so a declared primary key can still have duplicate values. Run this against the staging table and repeat it for the source.
SELECT note_id, COUNT(*) AS copies
FROM workspace.fulfillment_demo.shipment_notes_staging
GROUP BY note_id
HAVING COUNT(*) > 1;
If it returns rows, resolve the duplicates or pick a key that identifies one record on each side. For an order-line table, that might be the order ID and line number together.
Check the join before running it
Catalog Explorer has its own relationship view for tables with declared foreign keys. In Visual Schema, I could move the tables around the canvas and export the model as DBML.
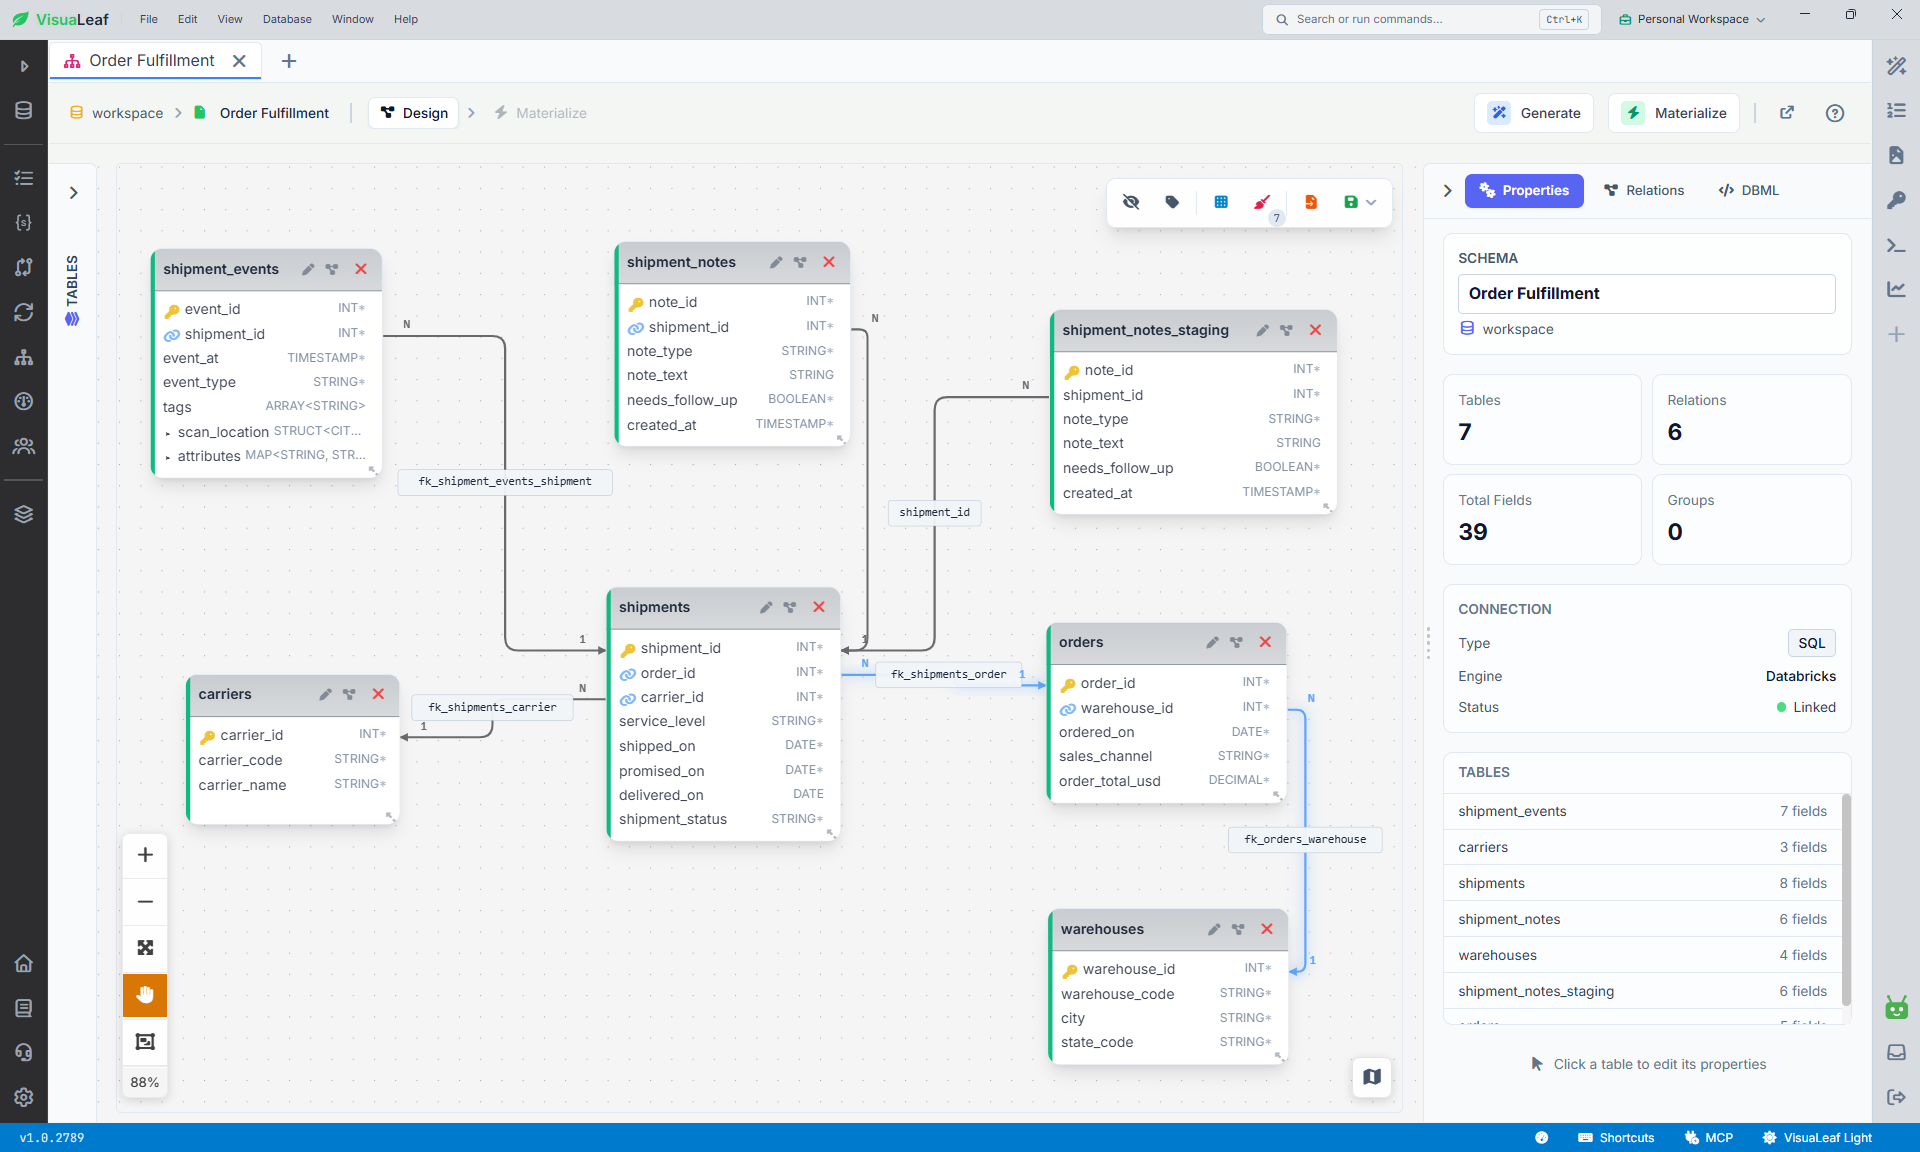
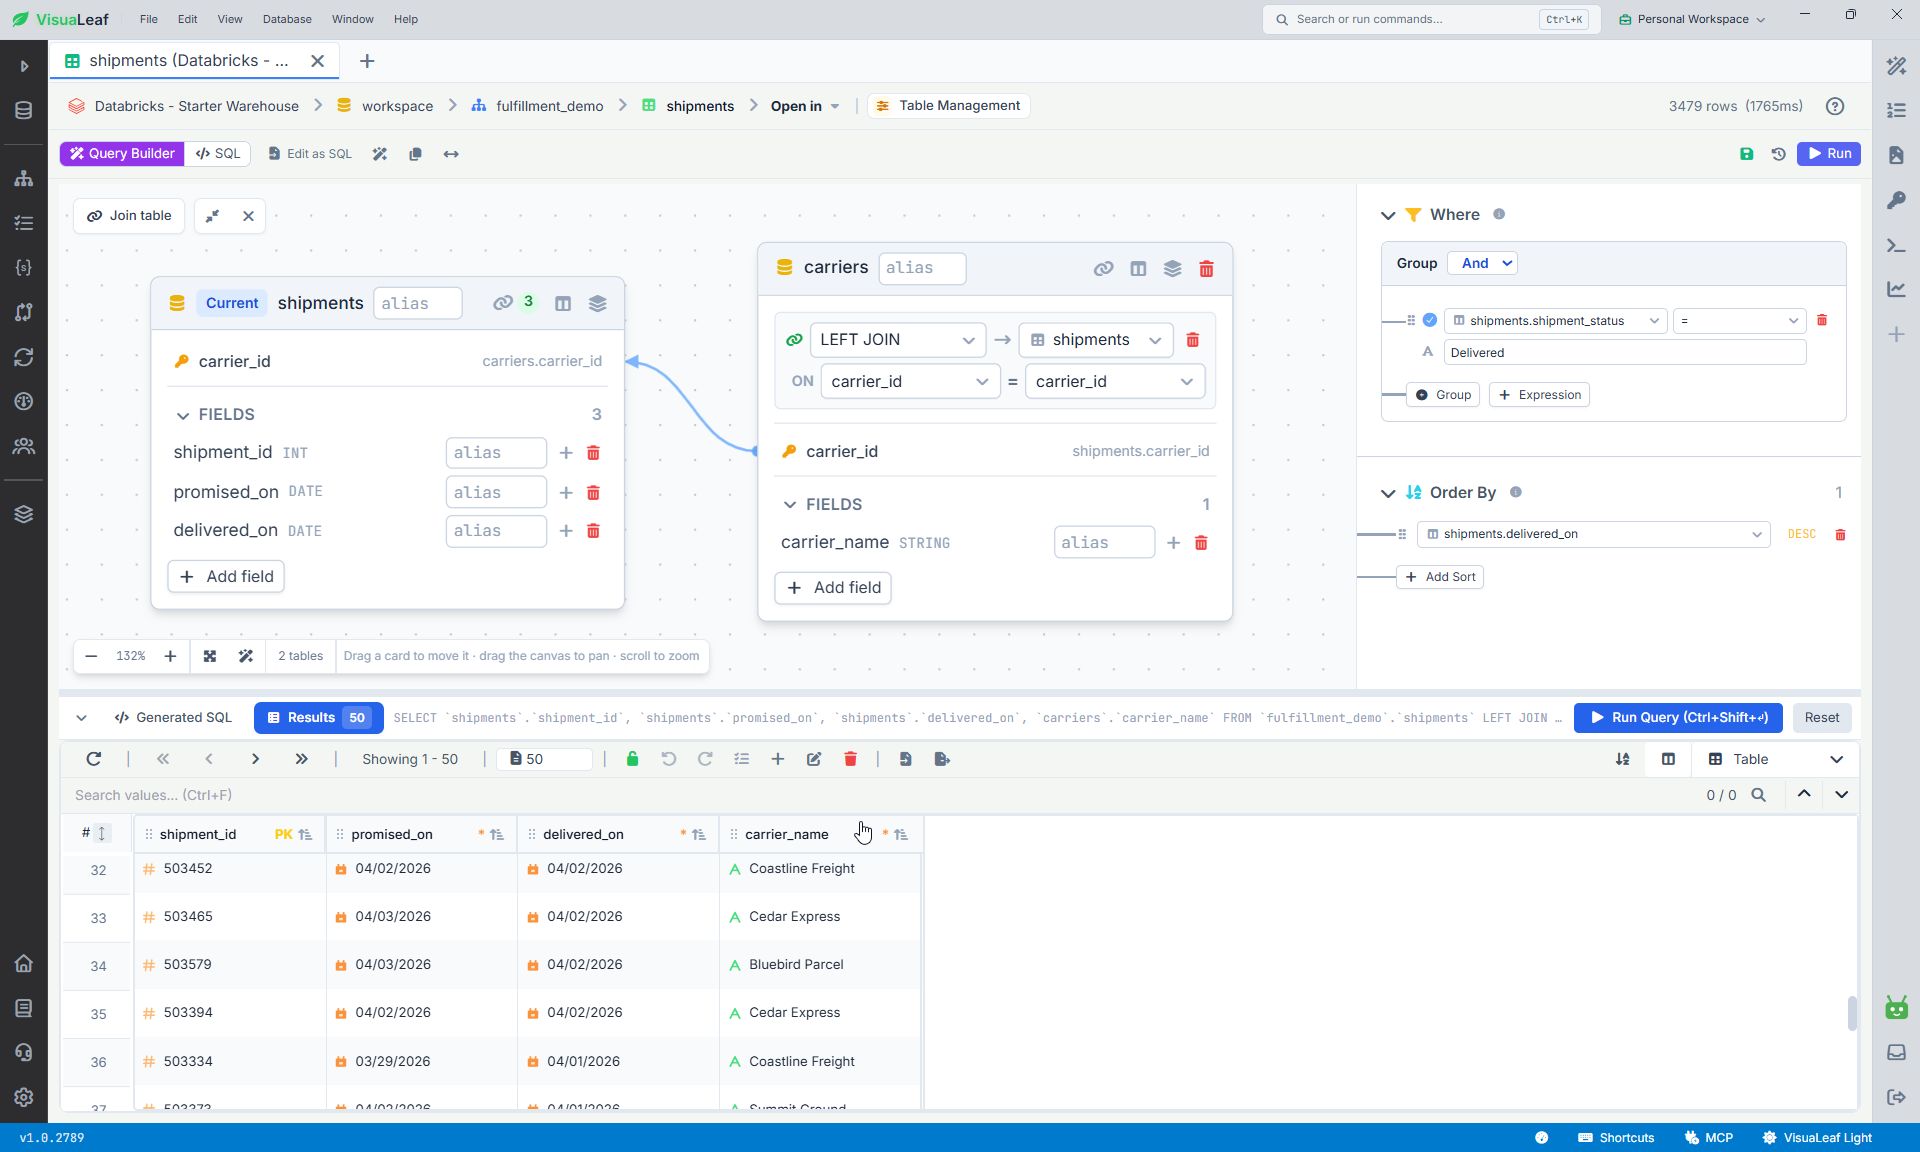
shipments.carrier_id` and carriers.carrier_id.Follow the line from shipments.carrier_id to carriers.carrier_id to find the columns for the carrier join.
I built the join in Visual Query Builder, filtered to shipment_status = 'Delivered', and sorted by delivered_on. The query returned 3,479 delivered shipments. If you join orders to shipments, an order with two shipments can appear twice. Count distinct order IDs when the metric is orders.
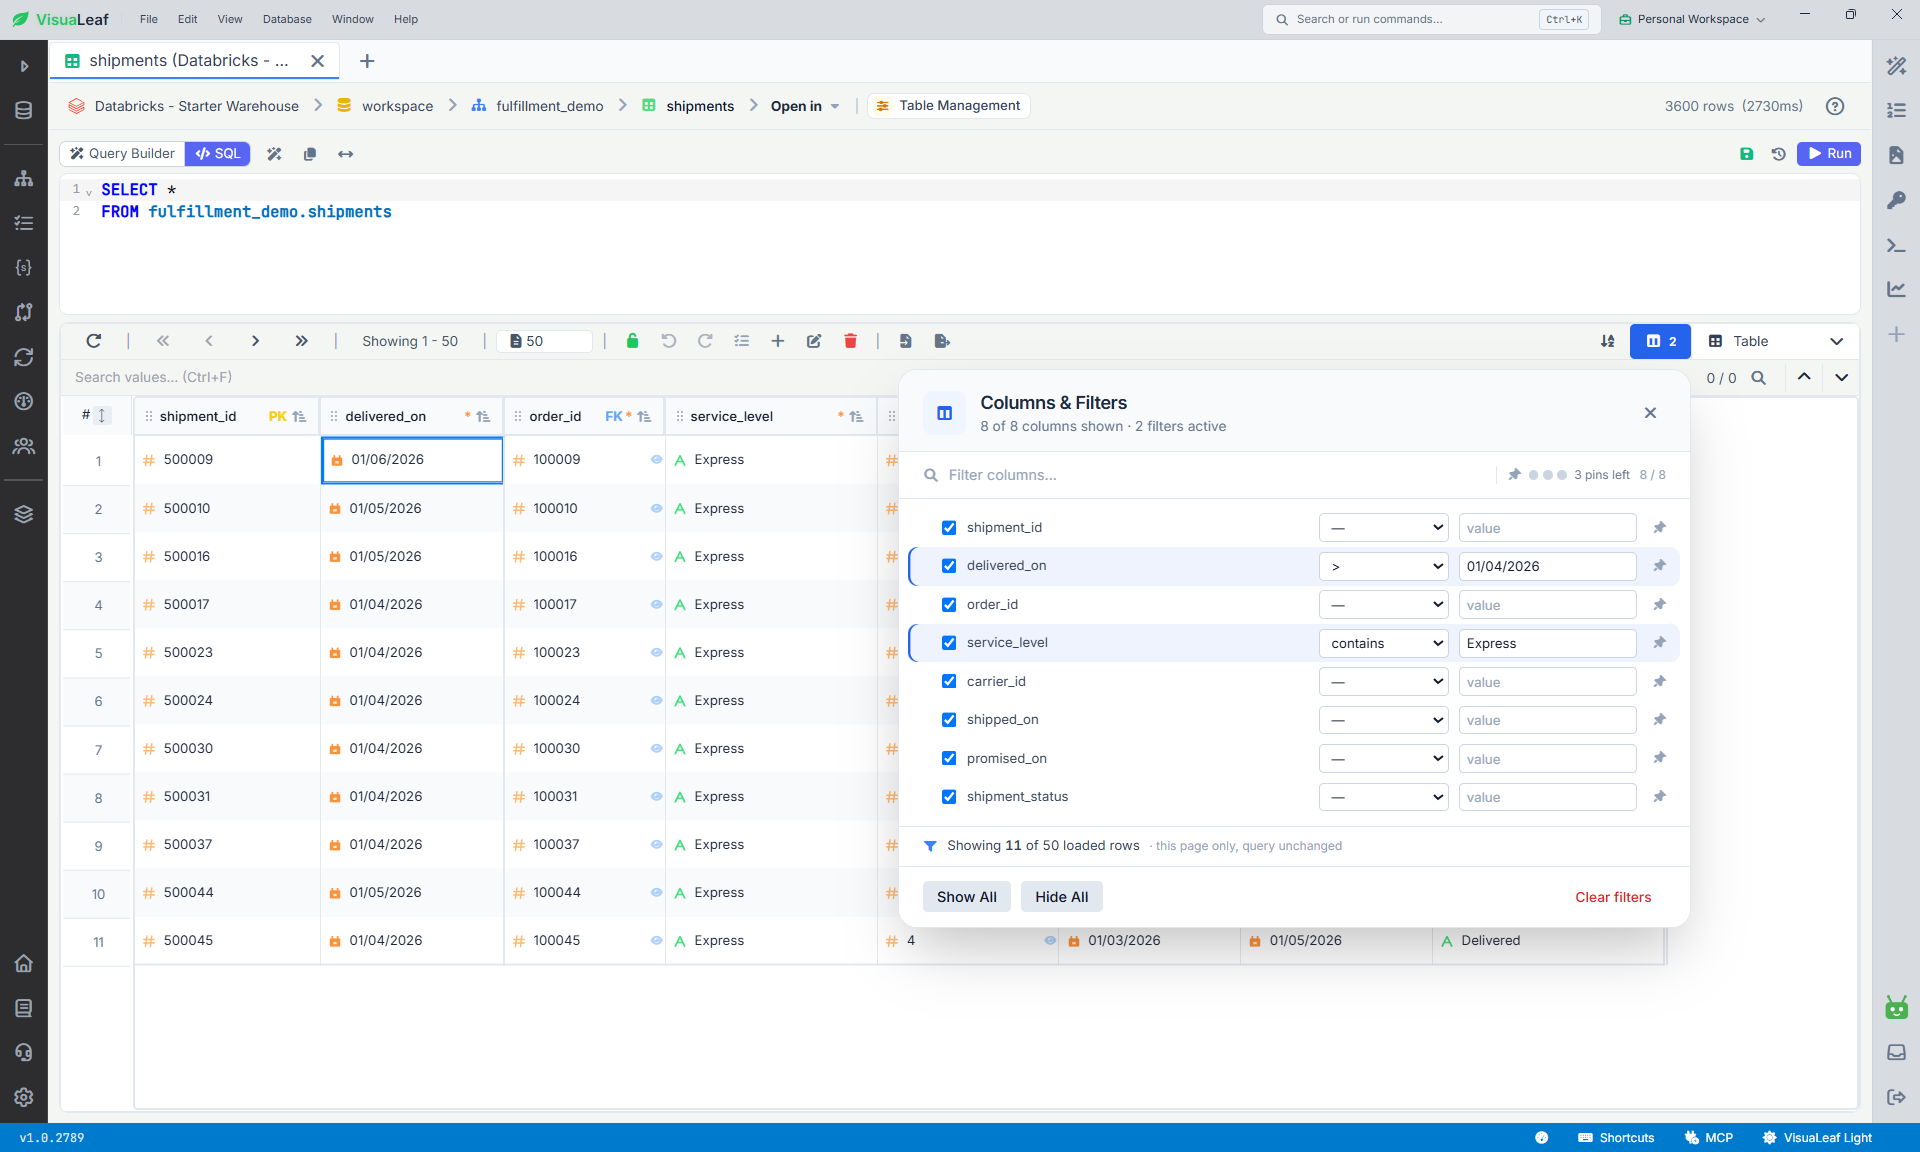
Columns & Filters in the result grid work on the loaded page. To apply those conditions across the table, put them in the query’s WHERE clause and rerun it.
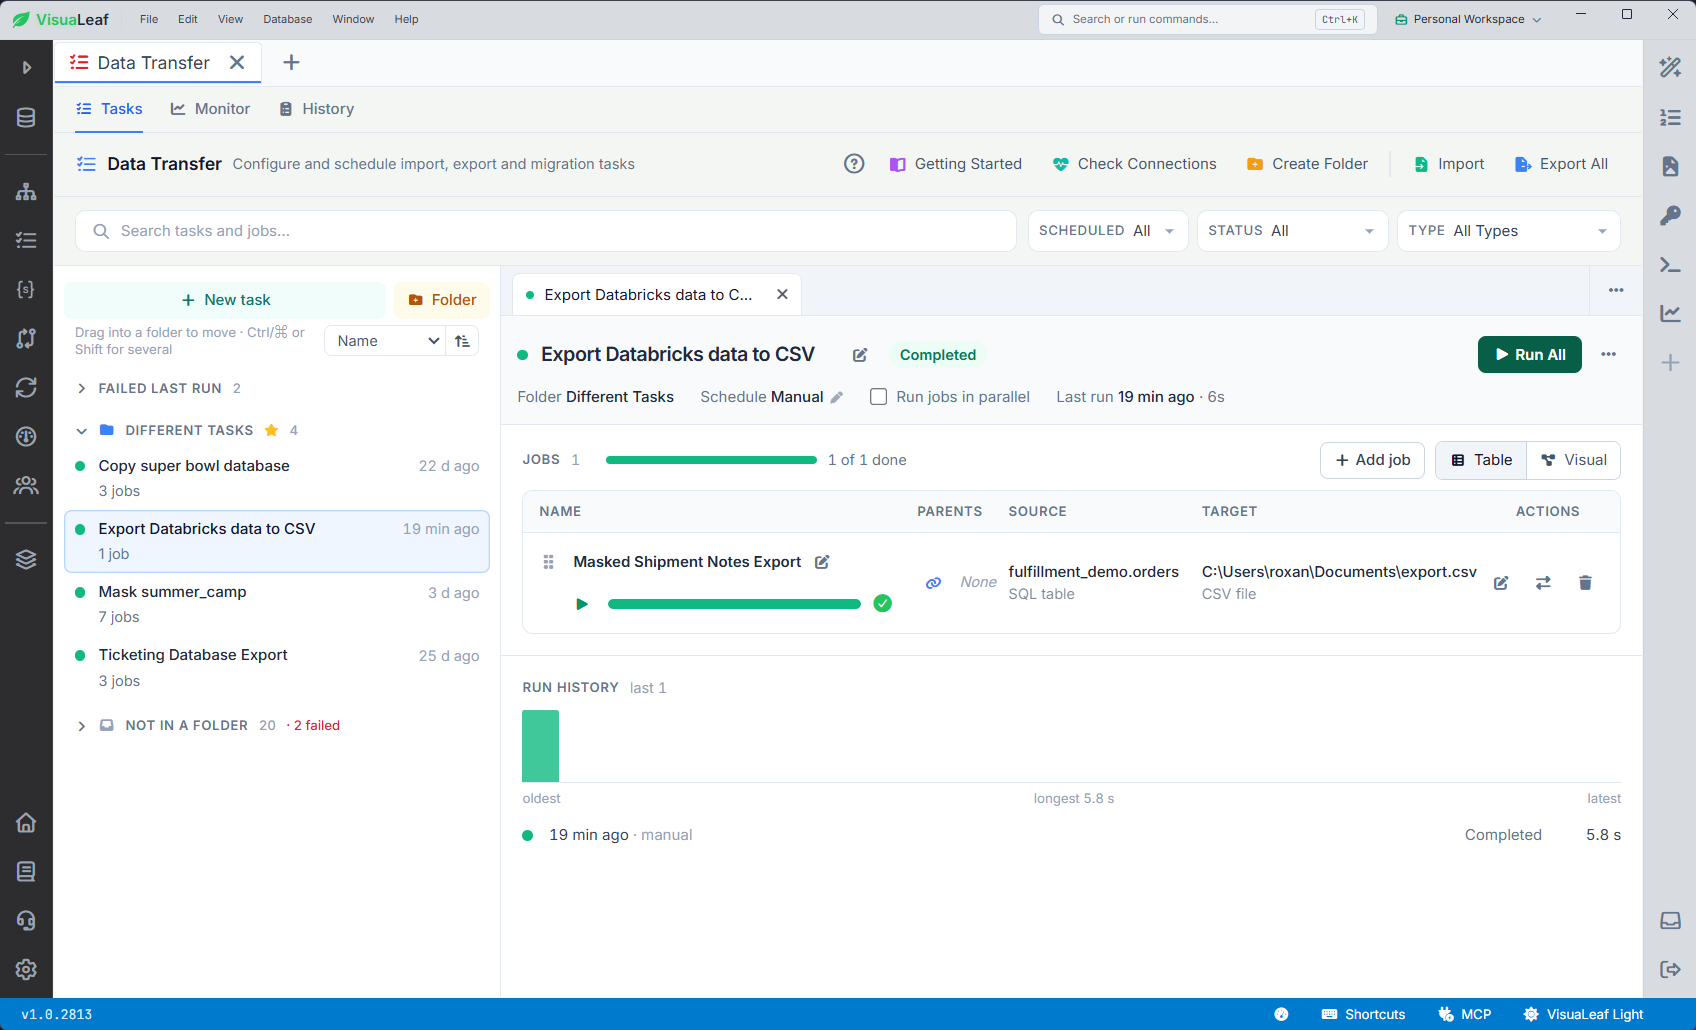
Save a CSV export you can rerun
I saved the orders export as a Data Transfer job so I could run it again. The table source worked. In a separate test with a custom SQL source, the preview returned rows and the field mapping stayed empty. If that happens and you need a filtered CSV, run your query in the Databricks SQL editor and download the result.
Databricks visualization and dashboard examples
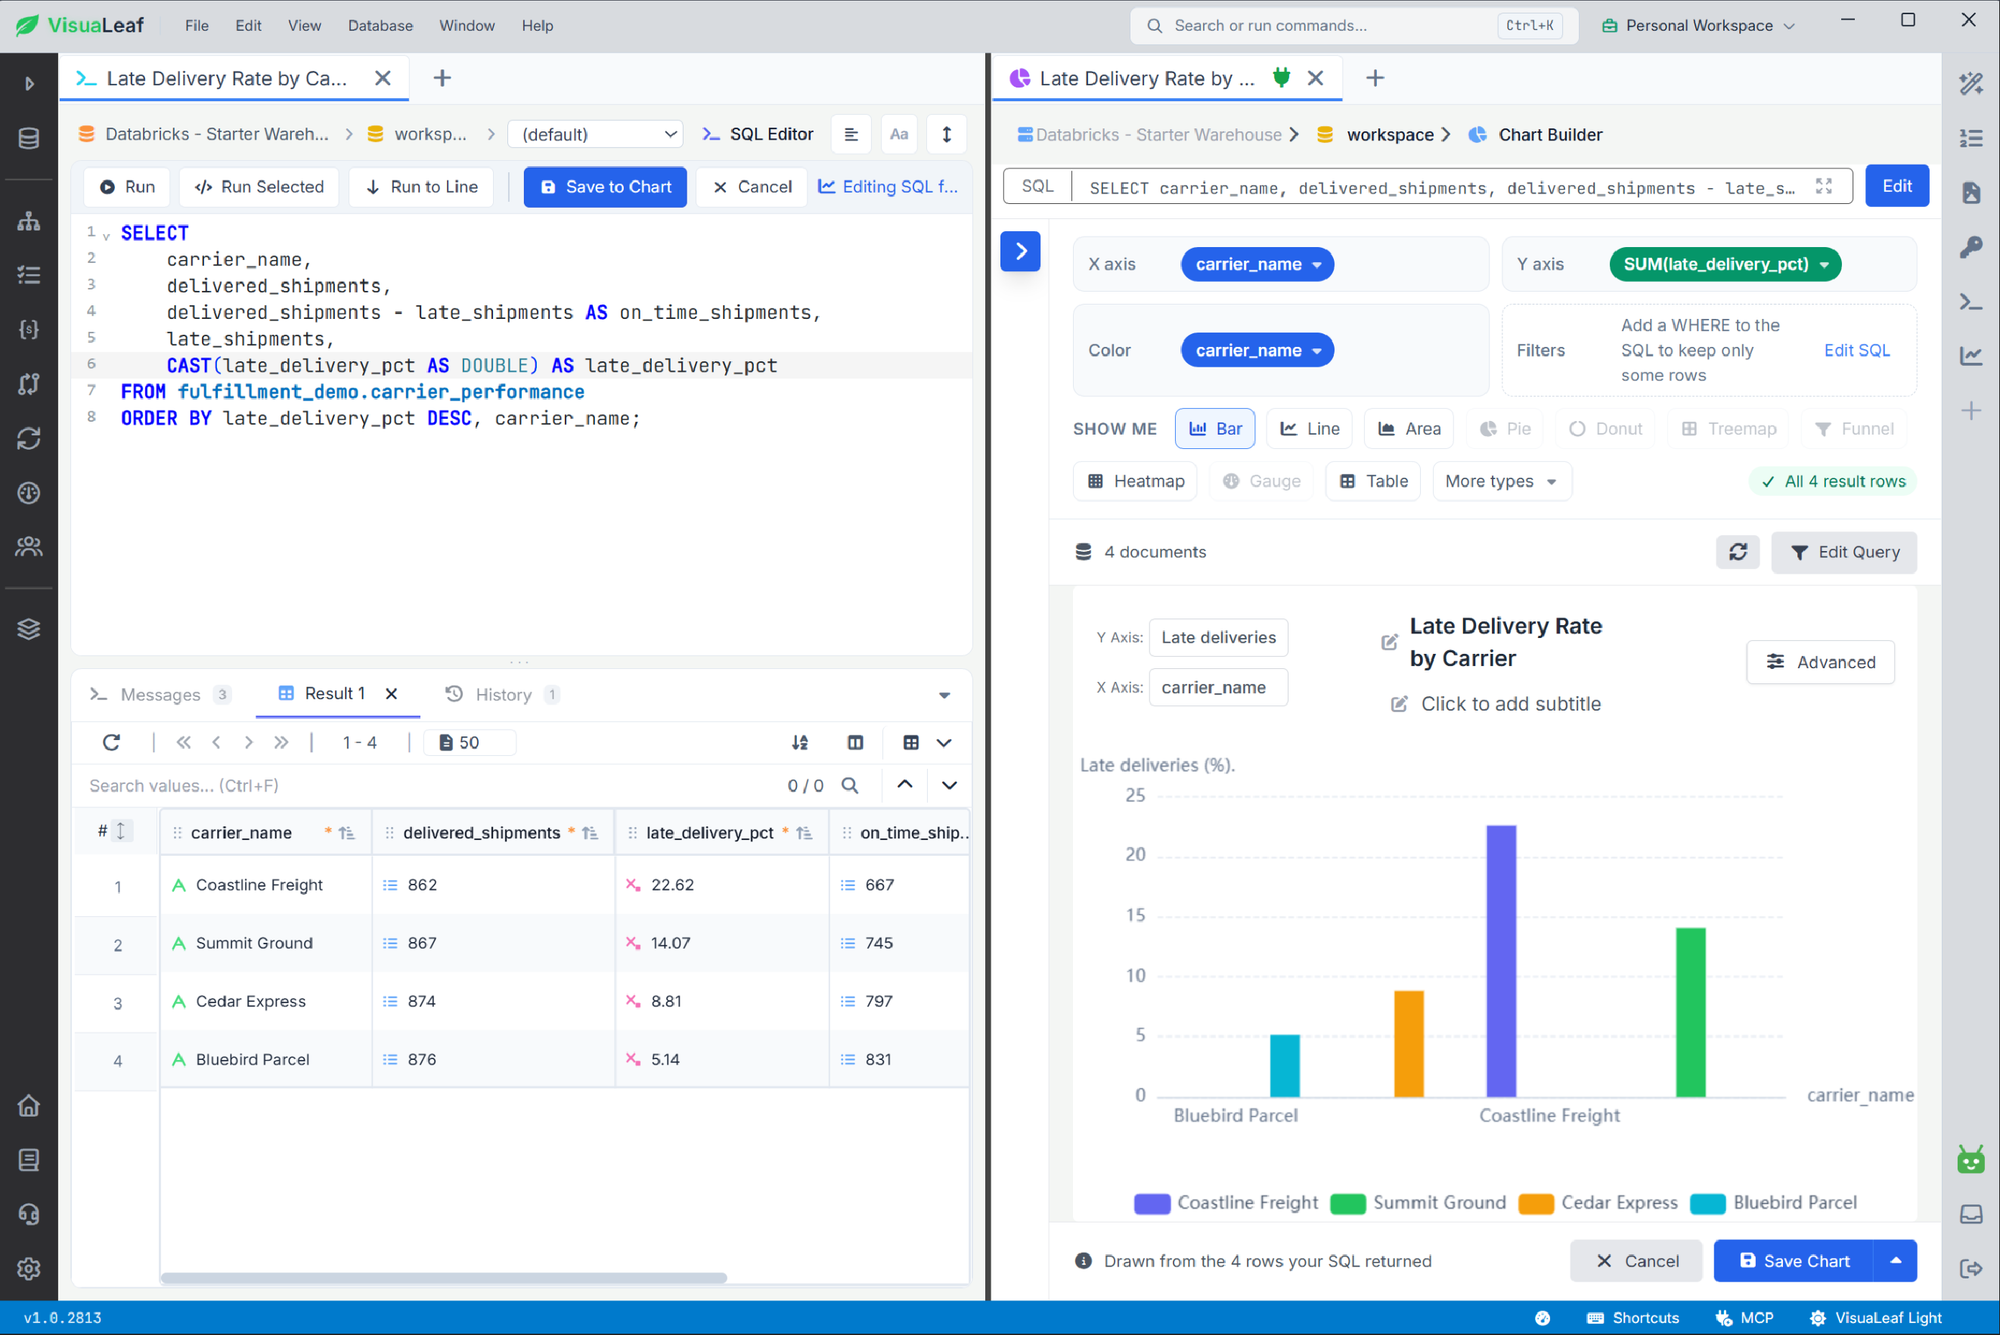
The demo has a carrier_performance view with one row per carrier. It divides late deliveries by completed deliveries. I kept both counts in the result so I could check the percentage in the chart.
SELECT
    carrier_name,
    delivered_shipments,
    delivered_shipments - late_shipments AS on_time_shipments,
    late_shipments,
    CAST(late_delivery_pct AS DOUBLE) AS late_delivery_pct
FROM workspace.fulfillment_demo.carrier_performance
ORDER BY late_delivery_pct DESC, carrier_name;
| Carrier | Delivered | Late | Late delivery rate |
|---|---|---|---|
| Coastline Freight | 862 | 195 | 22.62% |
| Summit Ground | 867 | 122 | 14.07% |
| Cedar Express | 874 | 77 | 8.81% |
| Bluebird Parcel | 876 | 45 | 5.14% |
In Chart Builder, I used carrier_name for the category and late_delivery_pct for the bar height. Keeping the chart beside the results in Split Panel Views made it easy to check the 22.62% against its denominator.
You could use the same data in a Databricks AI/BI dashboard to track the weekly late delivery rate or break it down by service level. Group by the promised date to report on shipments due that week. Before sharing, check whose data permissions the dashboard uses. Databricks can run its queries with the publisher’s or the viewer’s permissions.
Connect Power BI to Databricks
If your team reports in Power BI, open Get data in Power BI Desktop, choose the Databricks connector, and enter the warehouse hostname and HTTP path. Import loads a copy into Power BI and updates it on refresh. DirectQuery queries Databricks when people interact with the report.
Databricks SQL with Python
The Databricks SQL Connector for Python is for scripts that send SQL to a warehouse and fetch the result. This example uses a personal access token from an environment variable. Install databricks-sql-connector and set the three connection variables before running it.
from os import environ

from databricks import sql

with sql.connect(
    server_hostname=environ["DATABRICKS_SERVER_HOSTNAME"],
    http_path=environ["DATABRICKS_HTTP_PATH"],
    access_token=environ["DATABRICKS_TOKEN"],
) as connection:
    with connection.cursor() as cursor:
        cursor.execute("SELECT current_catalog(), current_schema()")
        print(cursor.fetchone())
A Unity Catalog Python UDF executes the Python on Databricks compute. I called delivery_outcome from VisuaLeaf’s SQL Editor, passing DATEDIFF(delivered_on, promised_on) to classify shipments as on time, late, or in transit. VisuaLeaf sent the SQL. Databricks ran the function on the warehouse. Use a serverless or Pro SQL warehouse for this kind of UDF.
Which Databricks tool should you open?
| Task | Where I’d start |
|---|---|
| Manage permissions, notebooks, or pipelines | Databricks web workspace |
| Compare two versions of a table or inspect a join | VisuaLeaf |
| Publish a dashboard for colleagues in Databricks | Databricks AI/BI dashboards |
| Build a report for a team that already uses Power BI | Power BI Desktop |
| Run SQL from your own script | Databricks SQL Connector for Python |
For a first run with your own data, download VisuaLeaf and start with source and staging tables from a refresh you can verify.
Is VisuaLeaf a Databricks App?
Databricks Apps is a service for hosting custom data and AI apps on Databricks. VisuaLeaf is a SQL client installed on your desktop. It connects to a warehouse to run queries and browse your data.