SQL Server Management on Windows, Mac & Linux with VisuaLeaf
A practical guide to SQL Server management in VisuaLeaf on Windows, Mac, and Linux: build queries, inspect schemas, use the SQL profiler, and migrate data.


A column definition, a query, an execution plan, and a migration job each describe the same data from a different angle, and in SQL Server work, you usually need all four open at once. This article walks through one SQL Server database in VisuaLeaf to show where its workspace helps.
VisuaLeaf brings these tasks into a desktop workspace with a SQL editor, visual query builder, table management, schema diagrams, profiling, data transfer, comparison, and charts. The screenshots here illustrate those workflows from SQL Server testing.
Establish the connection and permission boundary
A connection needs a server address, port, database, and supported authentication method. The selected database and schema also determine which objects your queries reference.
The connection dialog exposes the following authentication options.
| Authentication family | Options shown in the dialog |
|---|---|
| SQL Server | SQL Server login |
| Windows | NTLM with domain credentials, Kerberos, or this computer's login |
| Microsoft Entra user sign-in | Password or sign in with browser |
| Microsoft Entra workload identity | Service principal or managed identity |
| Microsoft Entra default | Default credentials, including the Azure CLI or environment configuration |
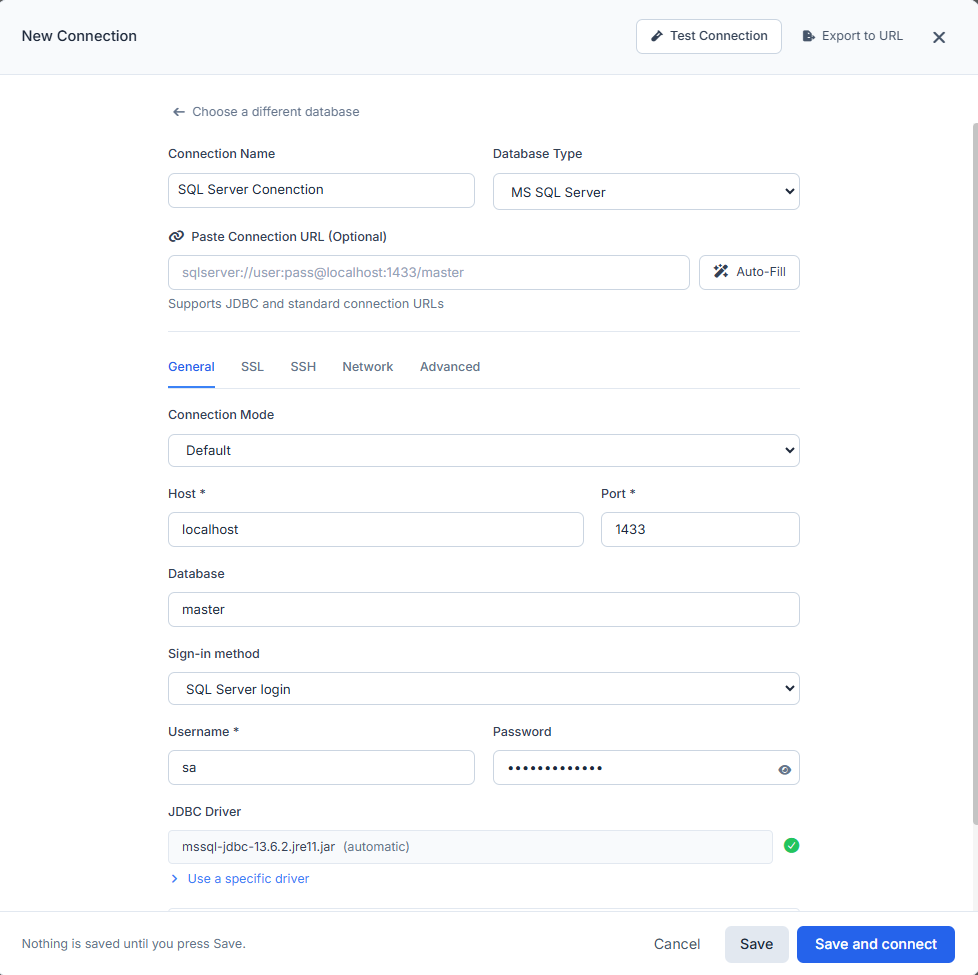
Or you can choose different sign-in methods:
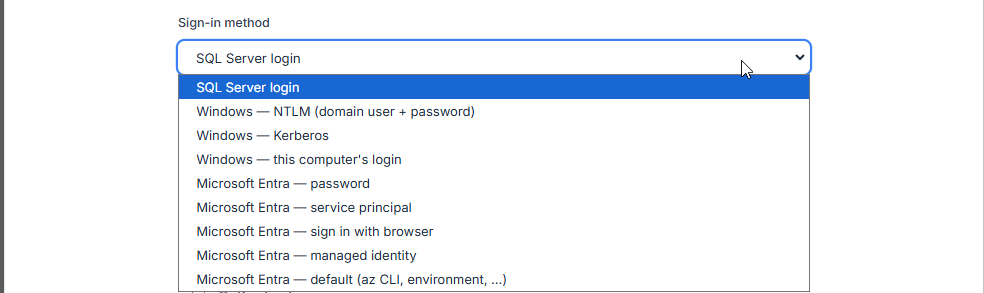
The completed connection test used a SQL Server login. Validate Windows authentication against your domain and Microsoft Entra authentication against your tenant, including its MFA requirements.
SQL Server permissions govern access to objects and operations. A reporting account can receive access to selected tables or views through database roles and grants. A client-side read-only setting adds an application control on top of those grants.
Inspect tables, constraints, and relationships
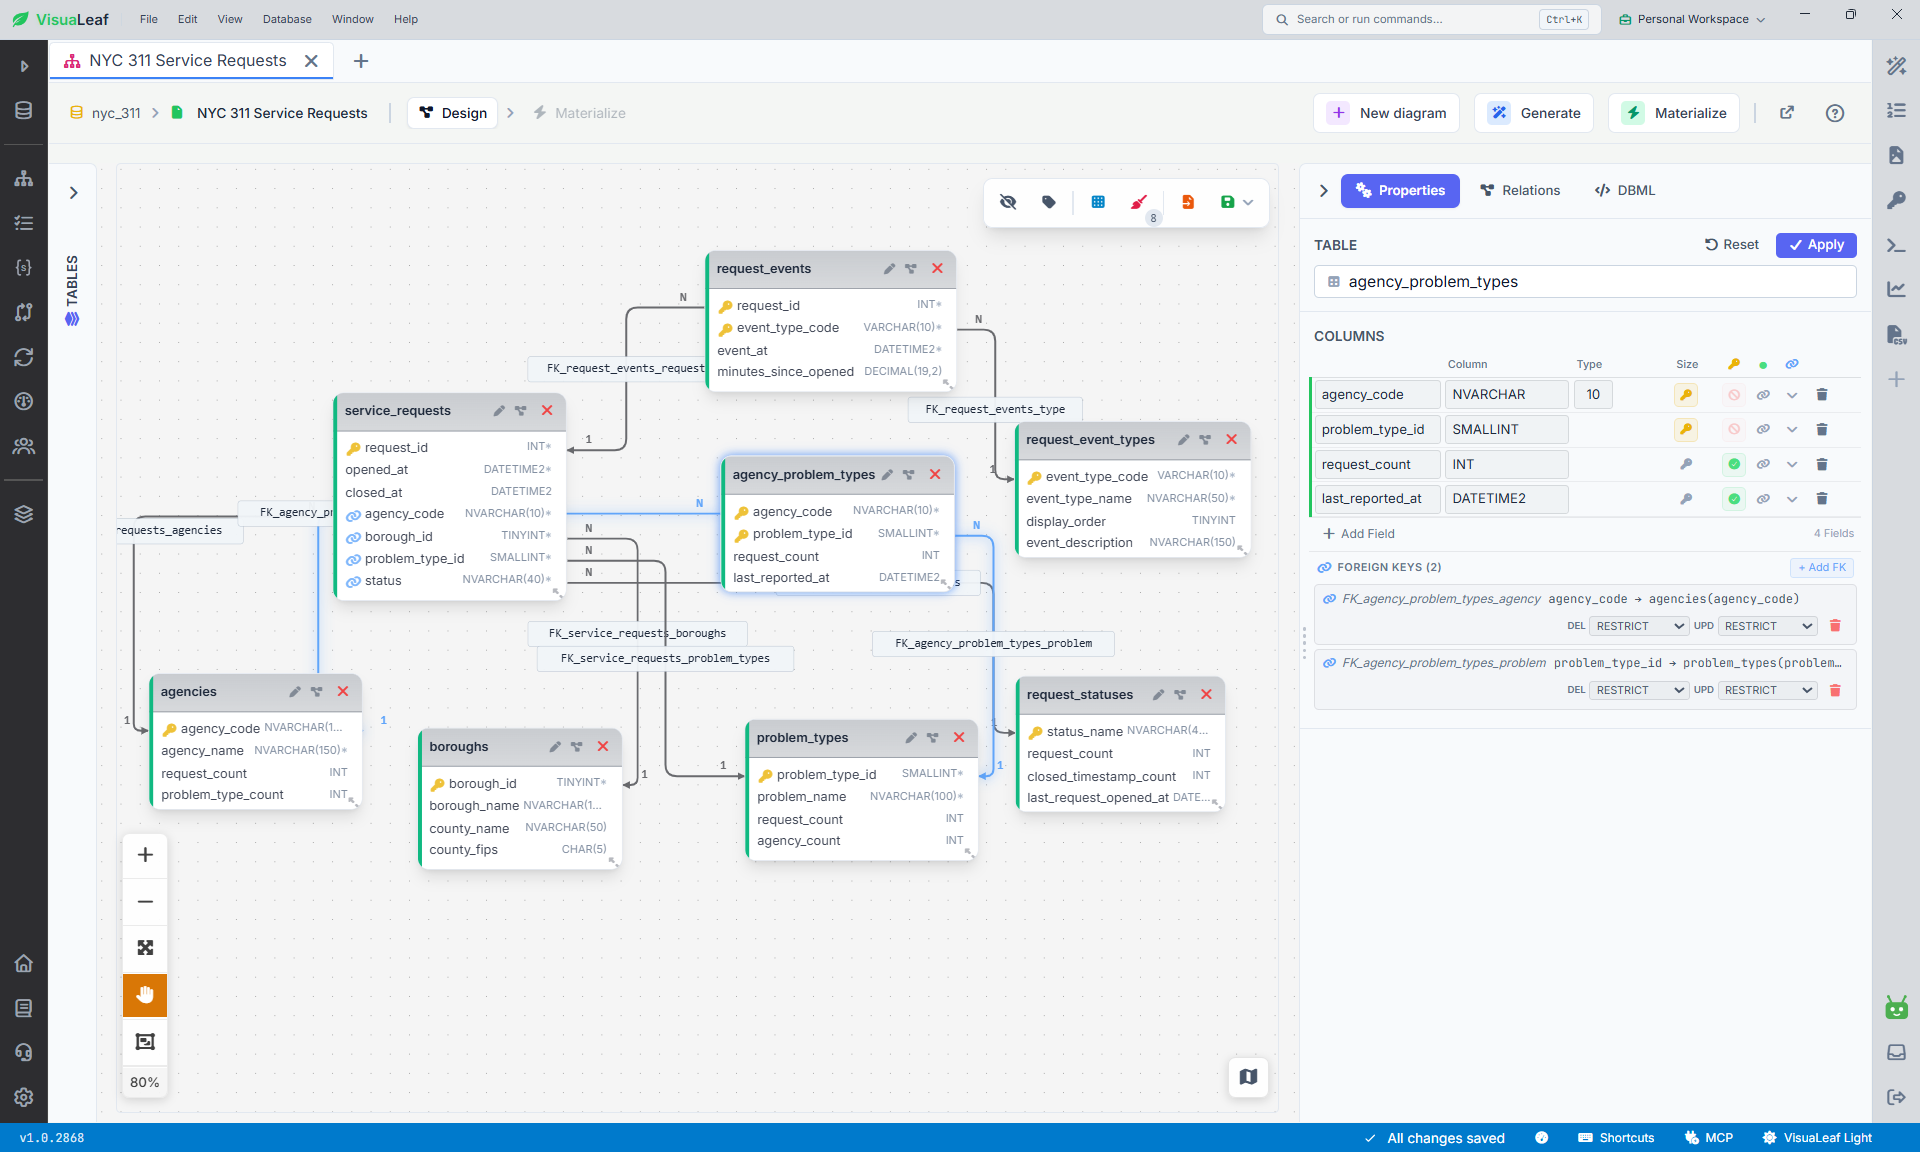
A column's data type is only part of its definition. Before changing a table or writing data, inspect the properties that SQL Server uses to validate each operation.
| Property | What it controls |
|---|---|
| Data type, length, and precision | Which values the column can represent |
| NULL / NOT NULL | Whether the column accepts a missing value |
| DEFAULT | The value supplied when an insert omits the column |
| IDENTITY | Automatic generation of numeric values |
| PRIMARY KEY / UNIQUE | Uniqueness of a column or combination of columns |
| FOREIGN KEY | Valid references to another key |
| CHECK | Conditions that inserted or updated values must satisfy |
VisuaLeaf's Table Management exposes column definitions, keys, indexes, and constraints, with generated DDL available for inspection. Read the generated statement when changing a definition so you can see the database operation behind the form.
An ER diagram provides the relationship view. Primary and foreign keys show how tables connect and which joins follow declared constraints. Indexes need separate inspection. SQL Server does not automatically create an index on the referencing columns when you add a foreign key.
Build queries visually and retain access to T-SQL
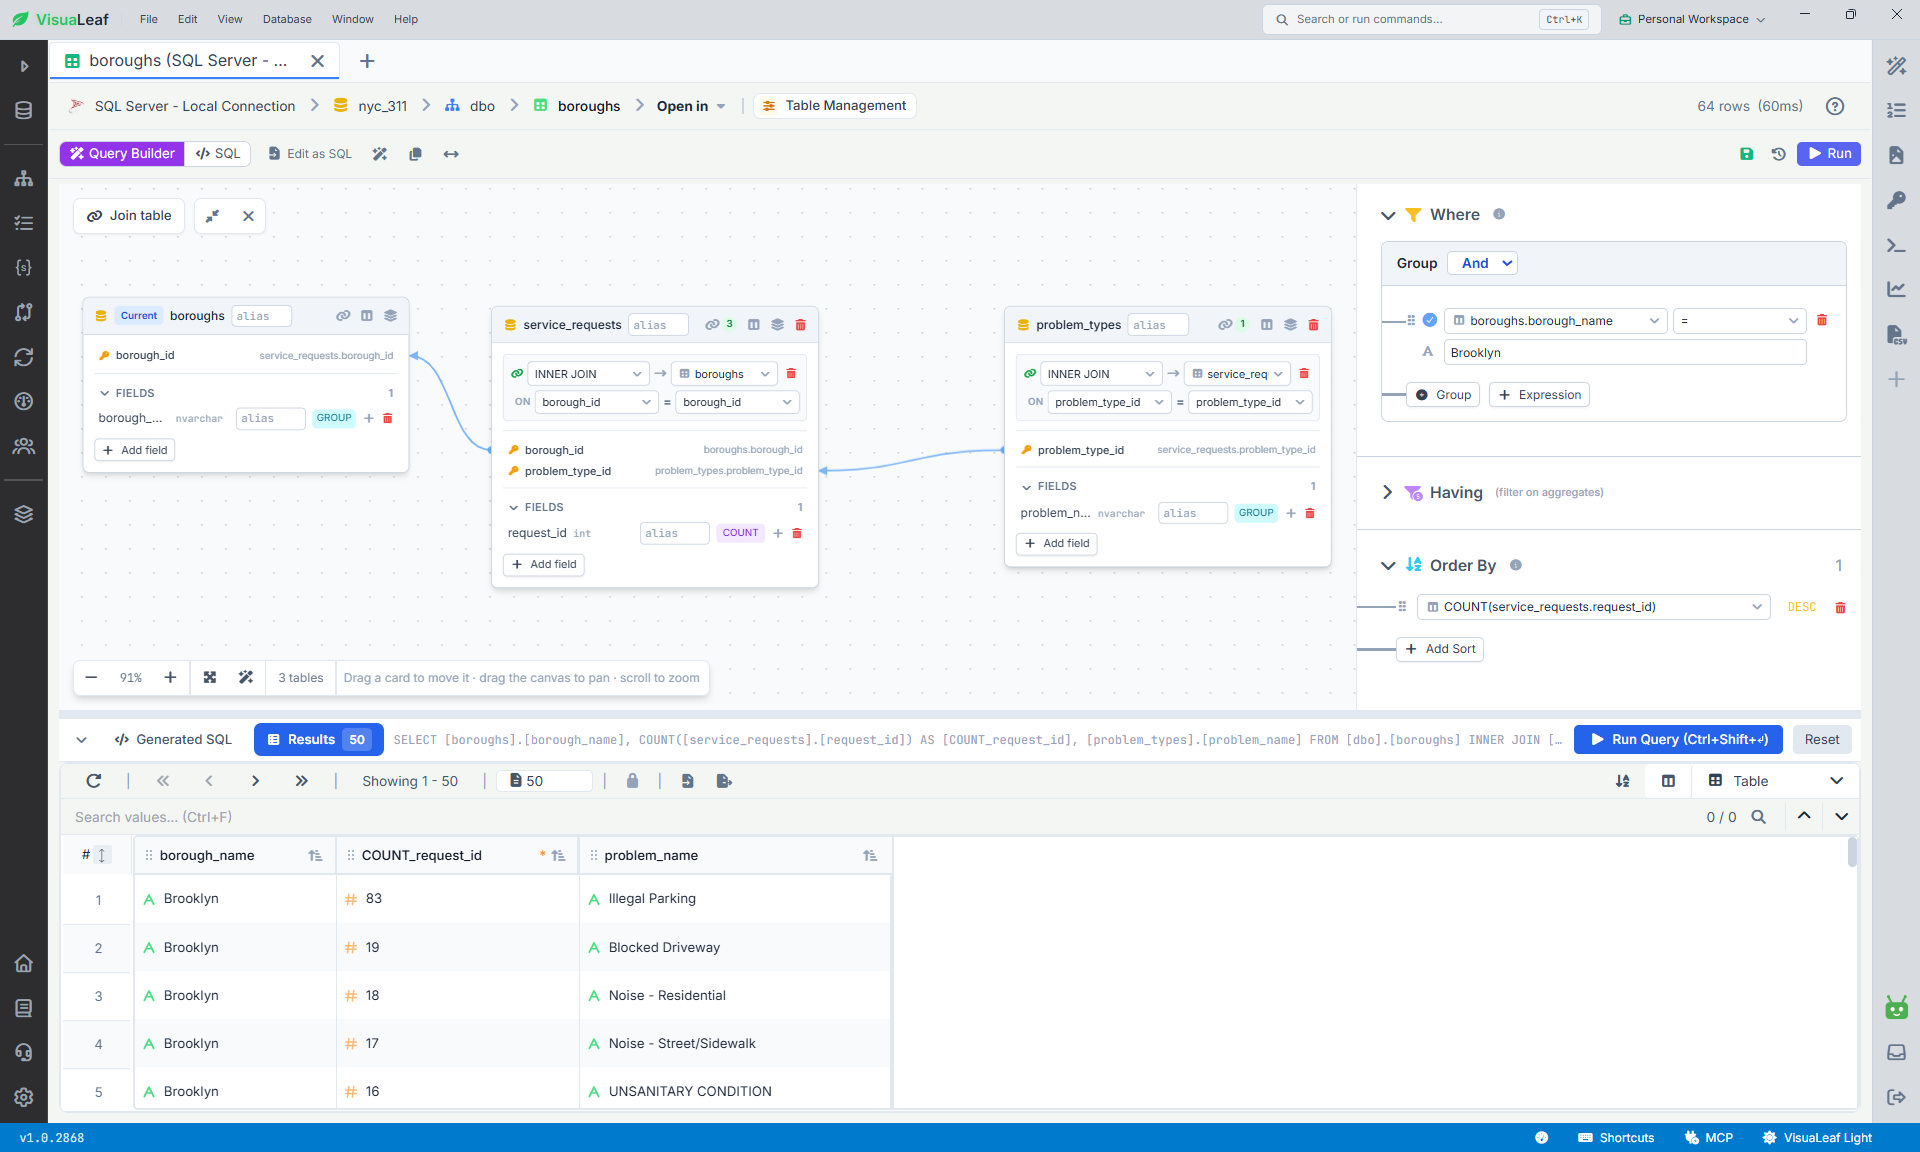
The visual query builder represents tables, join conditions, selected columns, filters, aggregates, and sorting on a canvas. Generated SQL changes with those settings, making the resulting statement available for review.
Join cardinality still matters. A one-to-many join can repeat a parent row before aggregation. Review the join columns and the unit being counted when adding another table.
Joins drawn along a foreign key also depend on indexing. SQL Server doesn’t create an index on the referencing columns, so a join that looks right on the canvas can still scan the whole child table:
ALTER TABLE dbo.OrderLine
  ADD CONSTRAINT FK_OrderLine_Order
  FOREIGN KEY (OrderId) REFERENCES dbo.[Order] (OrderId);

-- The constraint does not create this index. Add it yourself:
CREATE INDEX IX_OrderLine_OrderId ON dbo.OrderLine (OrderId);
A table can also supply a filter or join condition without contributing a selected output column. Its presence in the query graph can therefore remain necessary even when its field list is empty.
Use the SQL editor for CTEs, window functions, multi-statement scripts, and other T-SQL that needs direct editing. The tested workflow confirmed SQL generation from the visual builder. Start visually, then switch to the editor when the query needs more than the canvas can express.
Understand how row editing identifies and changes data
Before a grid can update a row, it needs a reliable way to find that row in the table. VisuaLeaf uses the primary key: a table with a key opens as editable, while a result that can’t be traced back to a single table and key opens read-only.
Note: Inline edits are written to the database as soon as you confirm them. For changes you may need to roll back, write the UPDATE in the SQL editor and check its auto-commit and transaction settings first.
Identity columns are handled for you. The Insert Row form marks them AI (auto-increment) and leaves them as Auto-generated, so SQL Server assigns the value. The AI badge is the useful signal here: a key icon only tells you a column is the primary key, not that SQL Server generates its value. If you insert an explicit value through T-SQL instead, SQL Server rejects it with Msg 544 unless IDENTITY_INSERT is turned on.
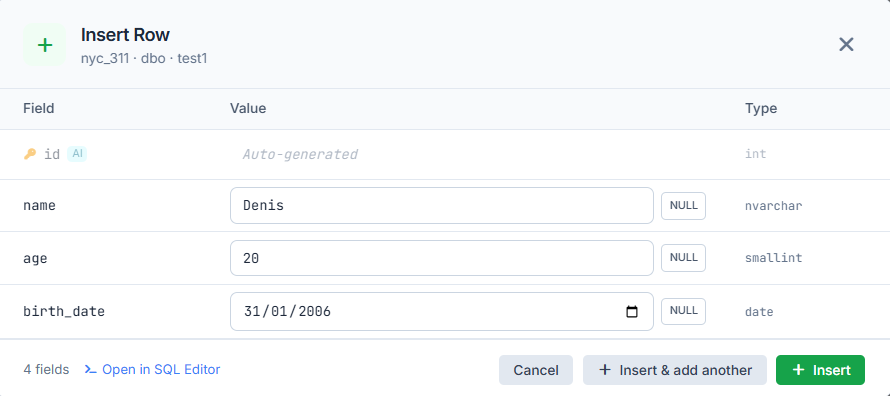
For more control, Open in SQL Editor moves the insert into the editor, where you can review the statement and run it inside a transaction.
Work with SQL Server features in their database context
T-SQL work can involve views, stored procedures, functions, and triggers as well as tables. Their definitions can contain filters, calculations, and write behavior that matter when reviewing an application database. VisuaLeaf lets you Server objects and edit their source alongside its query tools.
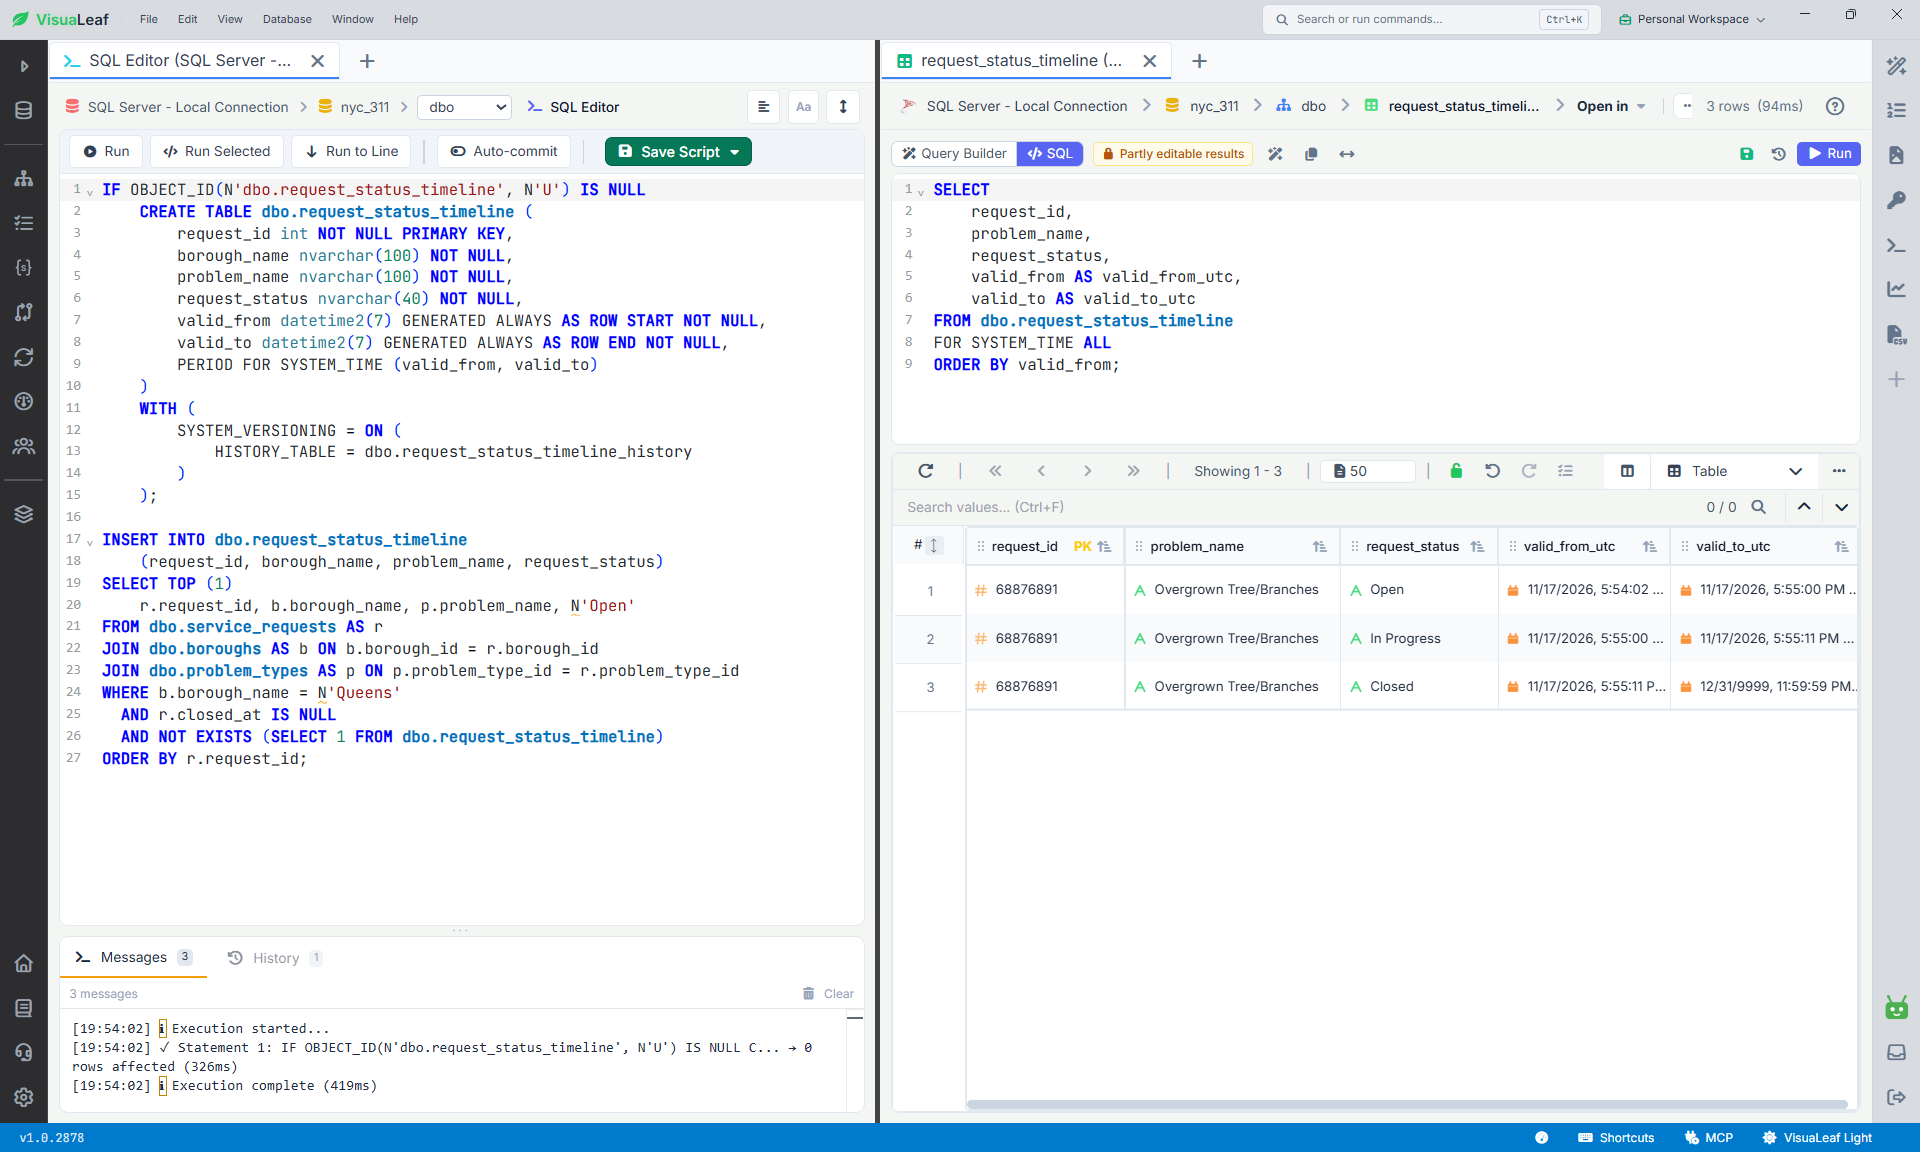
System-versioned temporal tables introduce another distinction. SQL Server maintains validity periods and row history through generated datetime2 columns and system versioning. A temporal query can return several versions of one logical record.
The temporal test displayed those versions with their validity periods. Review the system-time interval and UTC timestamps when interpreting history results, and distinguish the current row from its recorded versions.
Connect profiling statistics to execution plans
Profiling and execution plans answer different questions. Statement statistics show execution frequency and accumulated resource use. A plan describes the operators SQL Server uses to access and process rows.
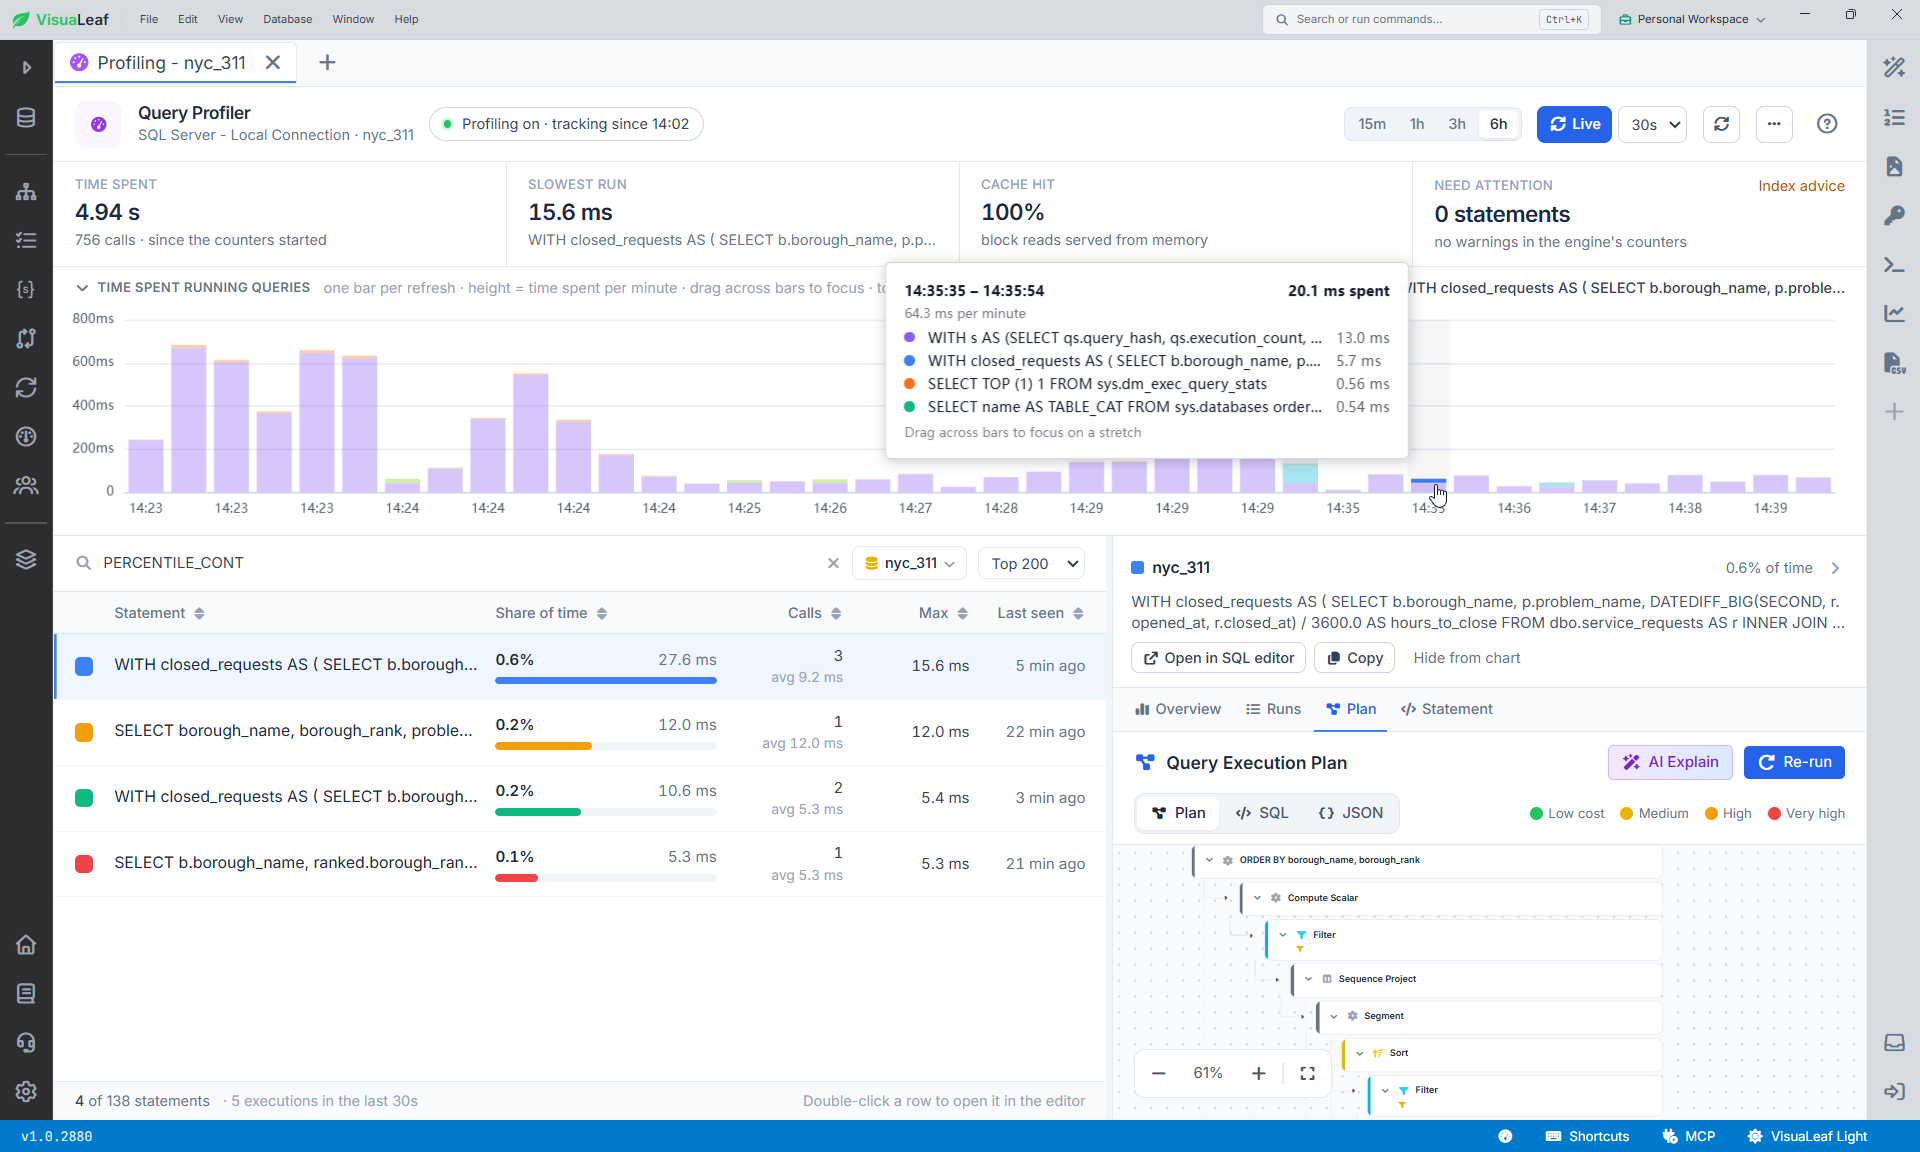
VisuaLeaf's profiler presents statement-level execution statistics and lets you inspect a selected statement. Total time, average duration, execution count, and maximum duration each show a different view of the workload. Match the displayed statement to the query you intend to investigate, since catalog and monitoring queries can also appear in the list.
The graphical plan makes scans, seeks, joins, sorts, aggregates, and spools easier to trace. Identify whether you are viewing an estimated or actual plan. Estimated costs describe optimizer estimates. Actual plans add runtime information that can help explain differences in row counts and execution behavior.
For SQL Server's cached statement statistics, the lifetime of the counters is tied to the cached plan. Plan eviction can remove the corresponding statistics. In the tested profiler, the Runs tab reported aggregate totals, and chart intervals reflected activity between refreshes. Interpret the time window and counter lifetime before comparing measurements.
Move data between engines and verify the result
Cross-database transfer requires explicit source, target, field, and type mappings. SQL Server types such as smallint and nvarchar need compatible target definitions. Review numeric ranges, text lengths, nullability, and generated-value behavior alongside the column names.
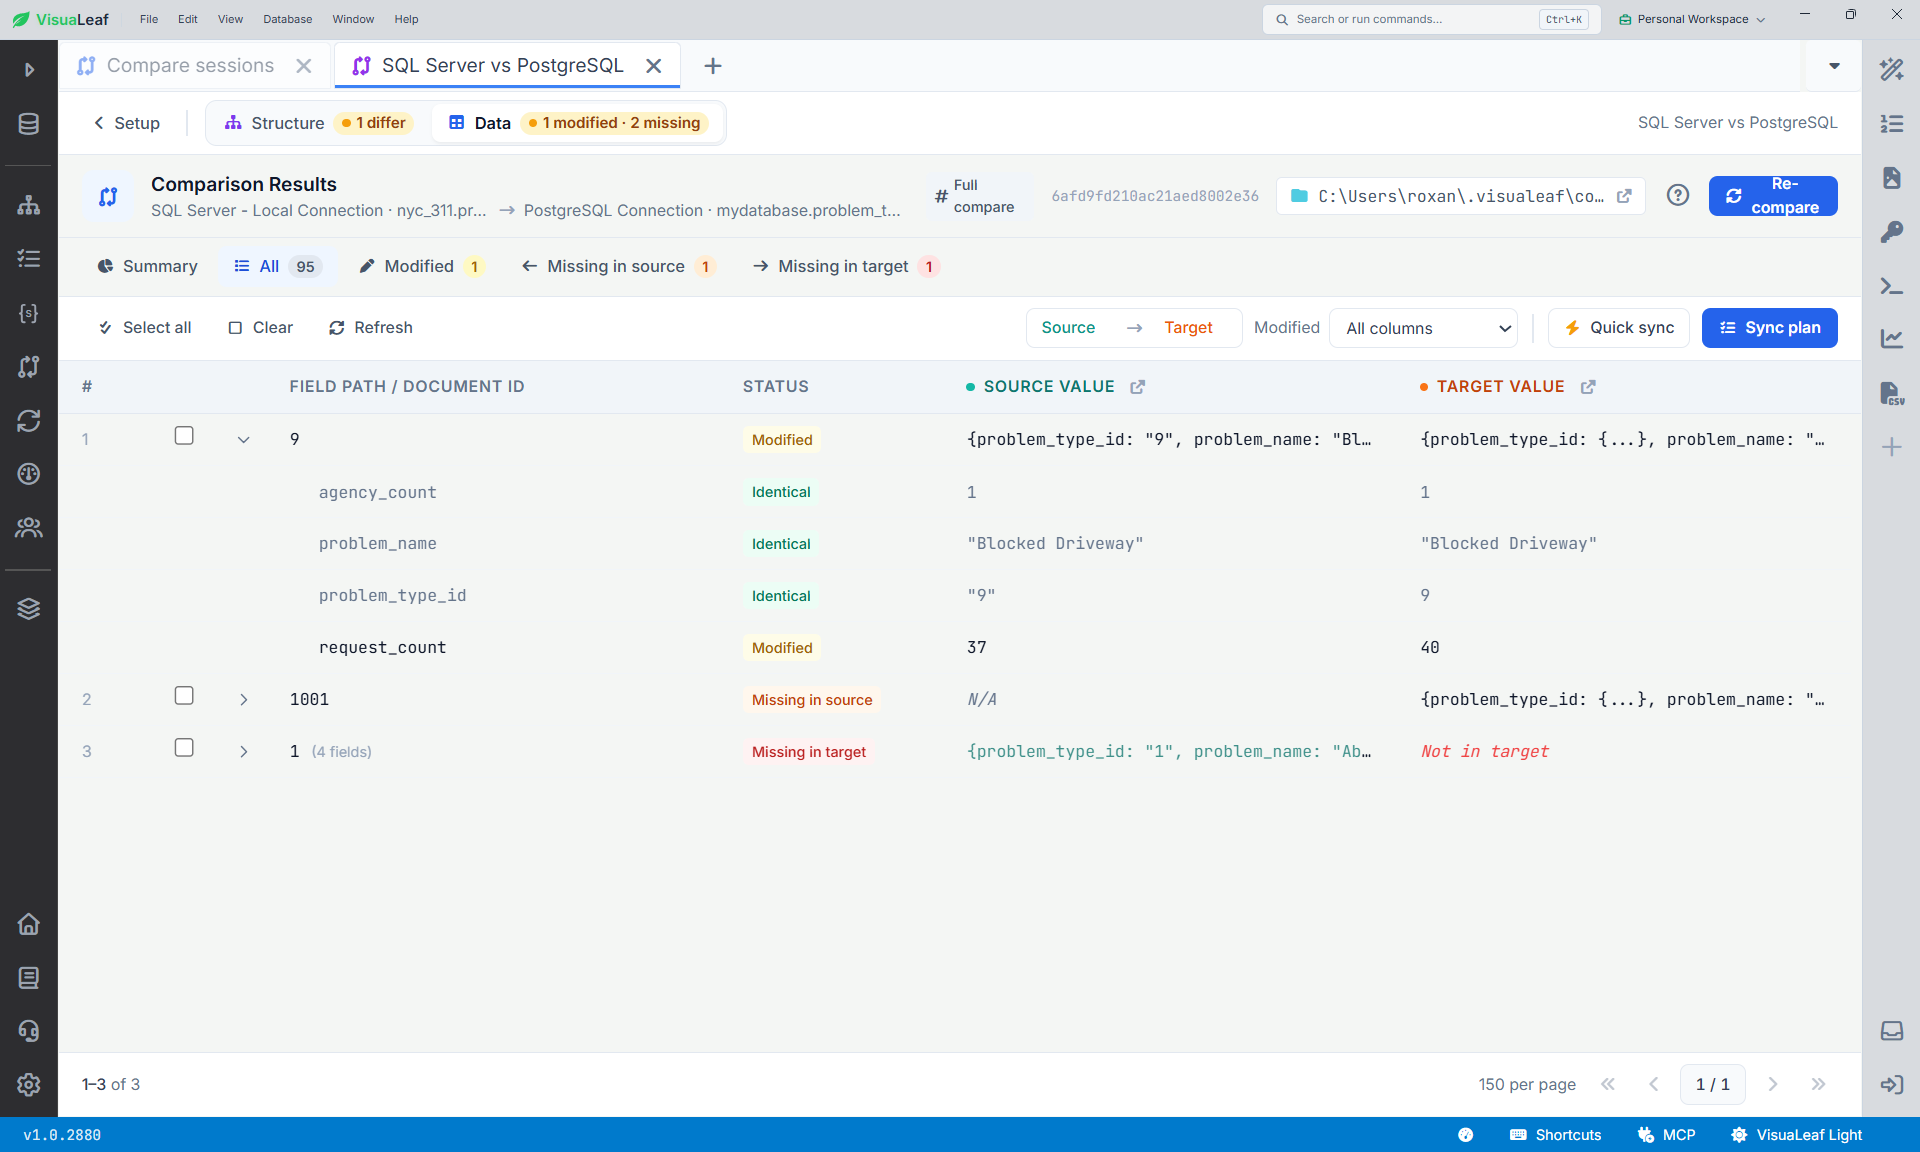
VisuaLeaf's transfer editor exposes source and target configuration, field mapping, transformations, and handling of existing rows. The SQL Server-to-PostgreSQL test completed a lookup-table transfer and displayed the target rows beside the job.
Use a stable key for the subsequent comparison. Match logical records by their identifying columns, then inspect changed values and rows present on only one side. Verify both row counts and content. Review schema objects such as indexes, defaults, foreign keys, and temporal definitions separately when planning a full migration.
Create charts from query results
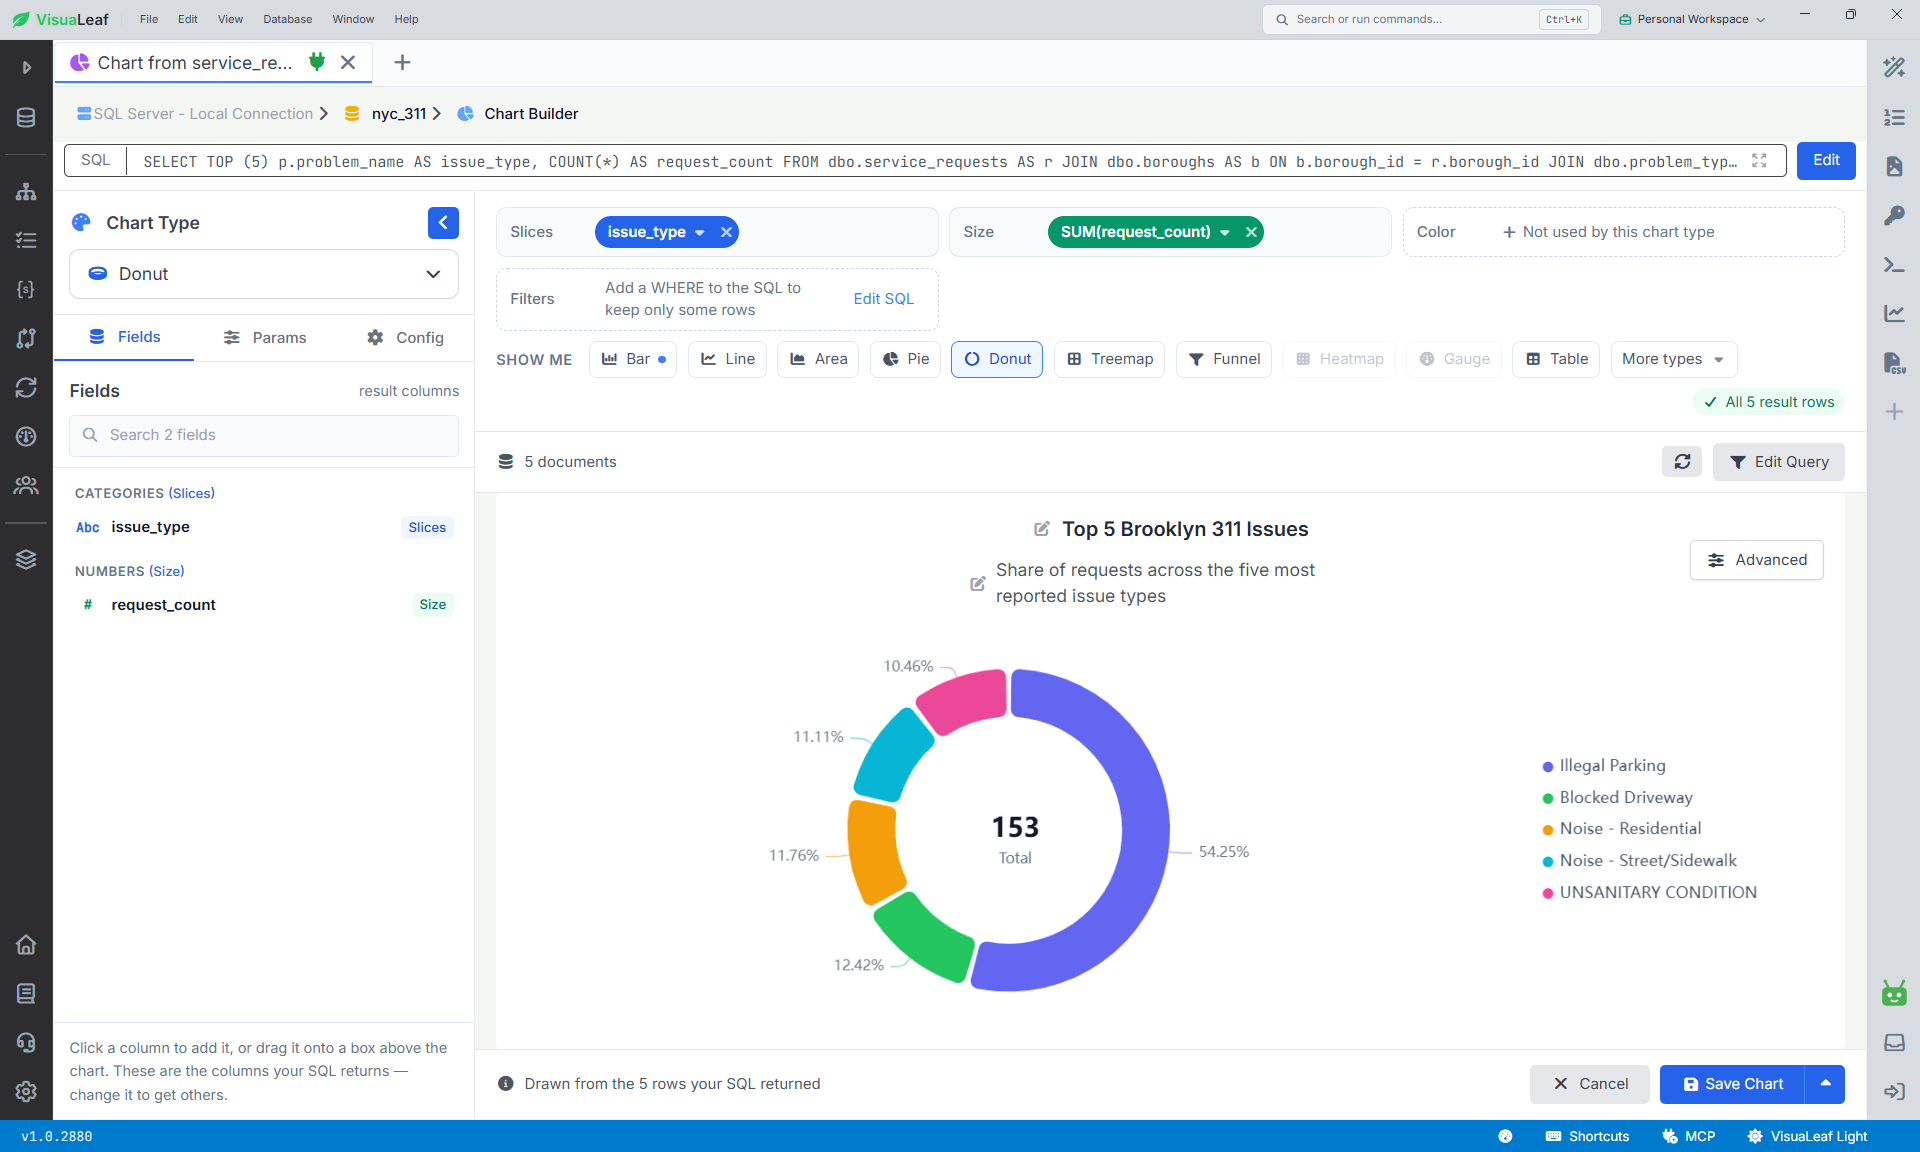
The Chart Builder maps SQL result columns to categories, numeric measures, and other visual dimensions. This keeps the query's joins, filters, and aggregation attached to the result being presented.
Check the aggregation at both stages. If SQL already returns a count per category, the chart should use that numeric count as its measure. Counting the returned result rows would measure the number of categories instead.
Also check the denominator behind percentages. A chart built from a limited result set describes that selected set. Its title and labels should make the scope clear.
Make VisuaLeaf your SQL Server workspace
VisuaLeaf brings SQL Server querying, schema inspection, data editing, performance investigation, reporting, and cross-database work into one visual workspace. You don’t have to switch between tools: you can write a query, inspect its plan, chart the result, and move the data to PostgreSQL in the same place.
It also runs where your team works. VisuaLeaf has Windows, macOS, and Linux clients, so everyone gets the same interface, whatever system they use. SSMS runs only on Windows, so macOS and Linux users need another tool.
This review focused on day-to-day development and analysis. Server administration, such as backup and restore, SQL Server Agent jobs, and Microsoft Entra sign-in with MFA, wasn’t part of the testing. If your work depends on those, try them against your own server during setup.
For writing queries, understanding schemas, tuning statements and moving data between engines, VisuaLeaf gives you a single cross-platform workspace with the SQL always visible behind the visual tools.
Download VisuaLeaf and connect it to your SQL Server database to try it.