MongoDB Workspace for Queries, Schema, Charts, and Teams
VisuaLeaf brings MongoDB queries, aggregations, schema diagrams, charts, dashboards, collection compare, and performance tools into one visual workspace.


MongoDB work is rarely just one task.
You may start by browsing a collection, but soon you need to build a query, test an aggregation, check the schema, create a chart, inspect indexes, compare data, or explain the database to someone else.
That is why VisuaLeaf is built as a visual MongoDB workspace.
Instead of keeping queries, aggregations, schema diagrams, dashboards, performance checks, and screenshots in separate places, VisuaLeaf brings the main MongoDB workflows closer together in one interface.
It is made for developers and teams who want to work visually, but still keep access to the generated MongoDB code when they need it.
Manage MongoDB connections in one place
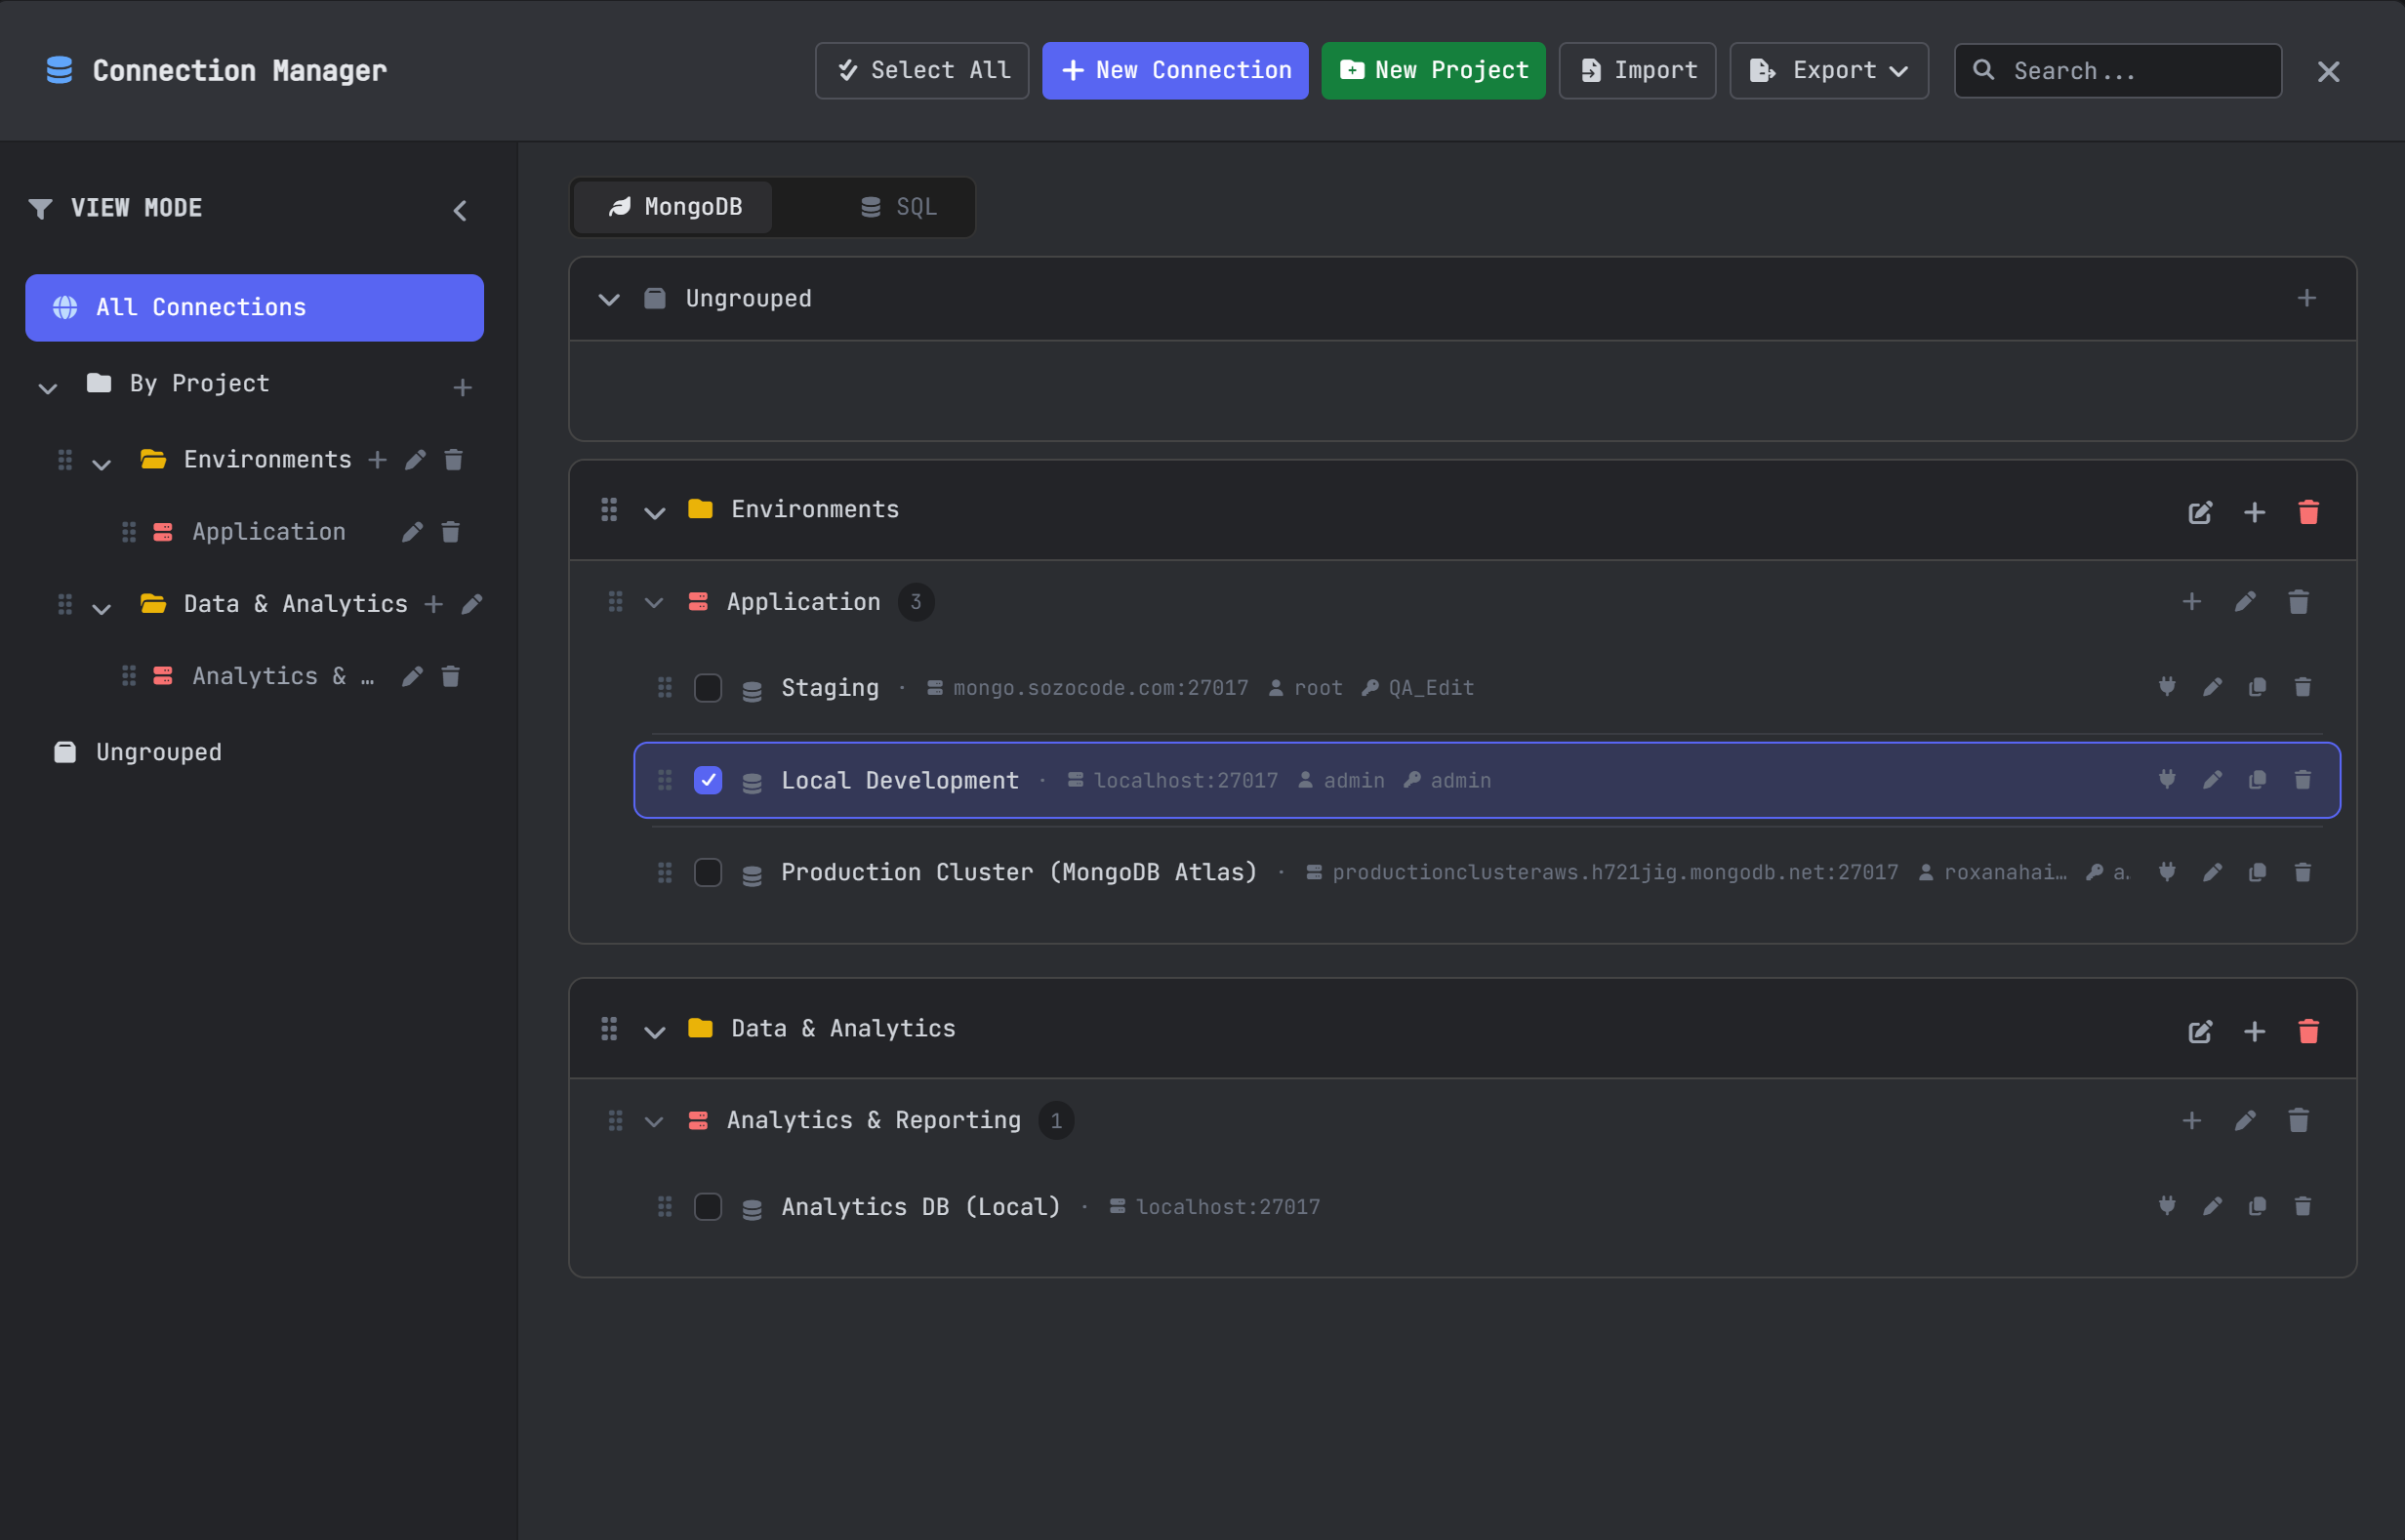
Most teams work with more than one MongoDB connection.
You may have a local database, an Atlas cluster, a staging environment, and production.
VisuaLeaf’s Connection Manager helps you organize and open your MongoDB connections from one workspace.
This is useful when you switch between projects, compare environments, or need quick access to the databases you use every day.
Instead of starting from zero every time, your MongoDB workspace starts with the connections you already work with.
Browse MongoDB collections in different views
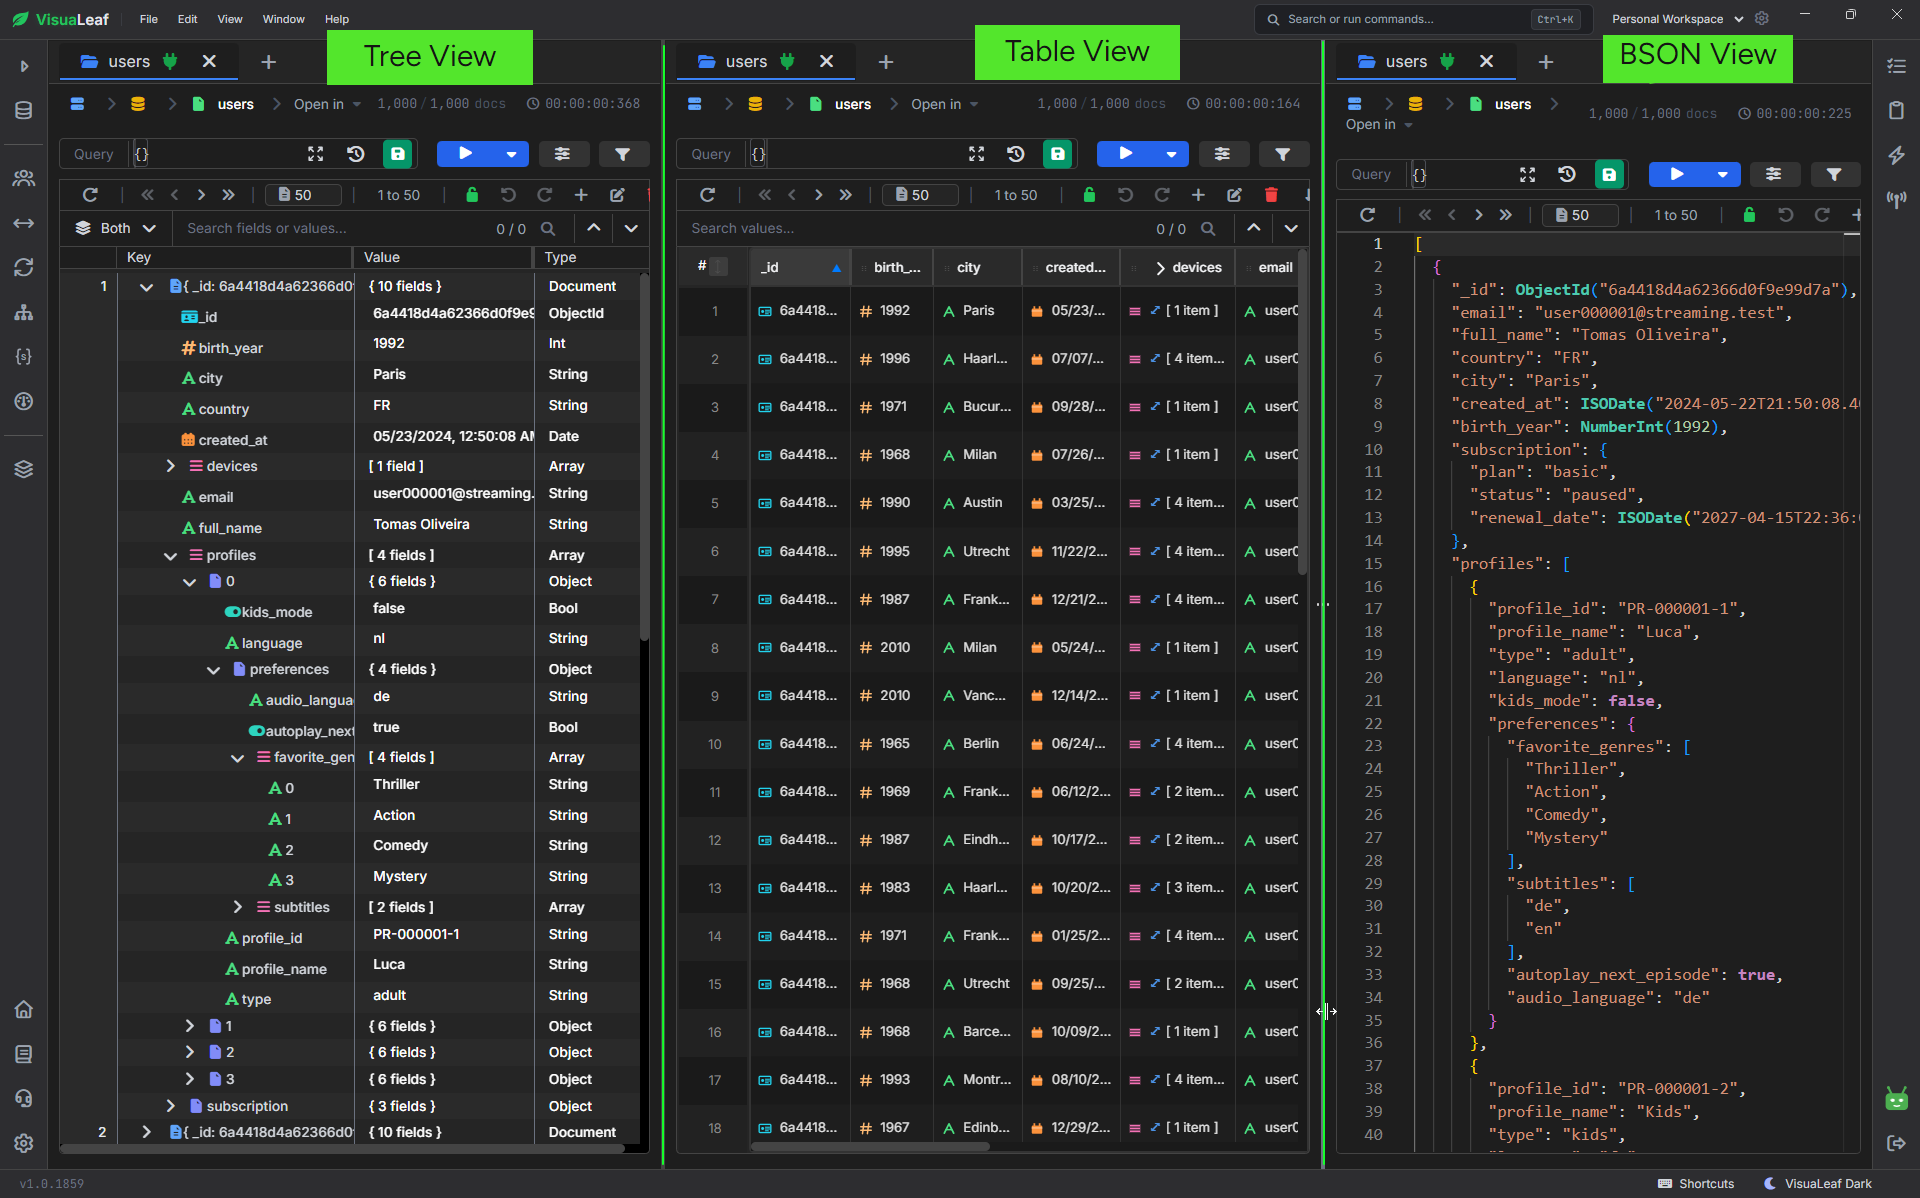
The first job of any MongoDB tool is simple: help you see the data clearly.
In VisuaLeaf, you can browse collections in different views, depending on what you need.
Use Tree View when the documents are nested, and you want to open fields step by step.
Use Table View when you want to scan many documents quickly.
Use JSON or BSON View when you need to inspect the raw document structure.
This is useful when you are debugging real data, checking nested fields, reviewing documents, or explaining a collection to someone else.
You can also insert, edit, and delete documents from the same workspace, so basic data work does not become slower than it needs to be.
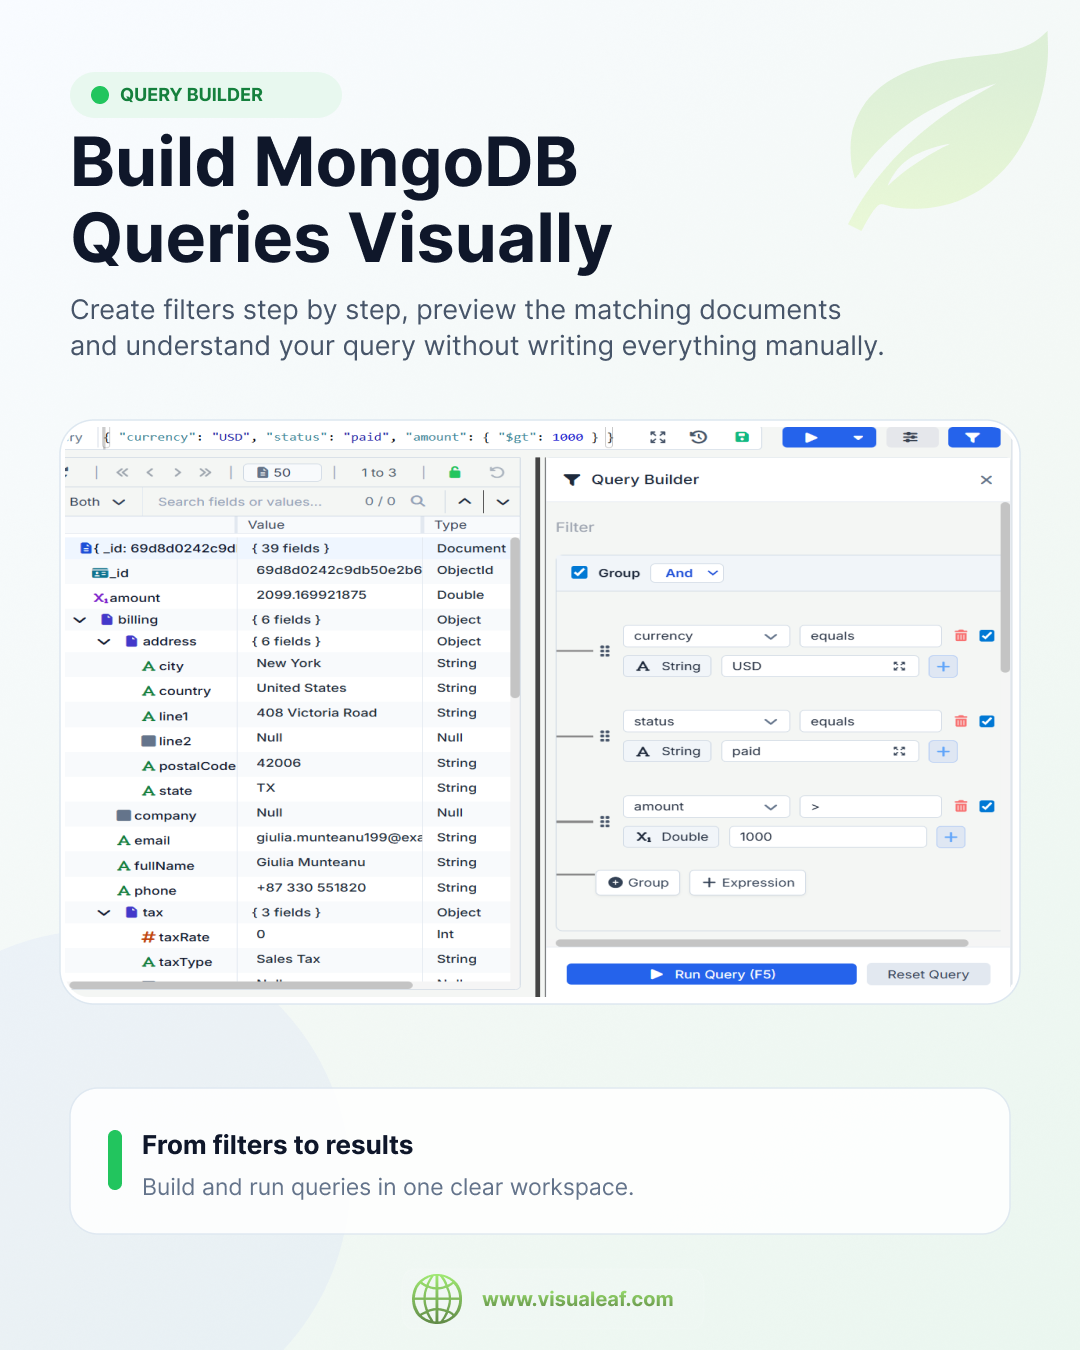
Build MongoDB queries visually
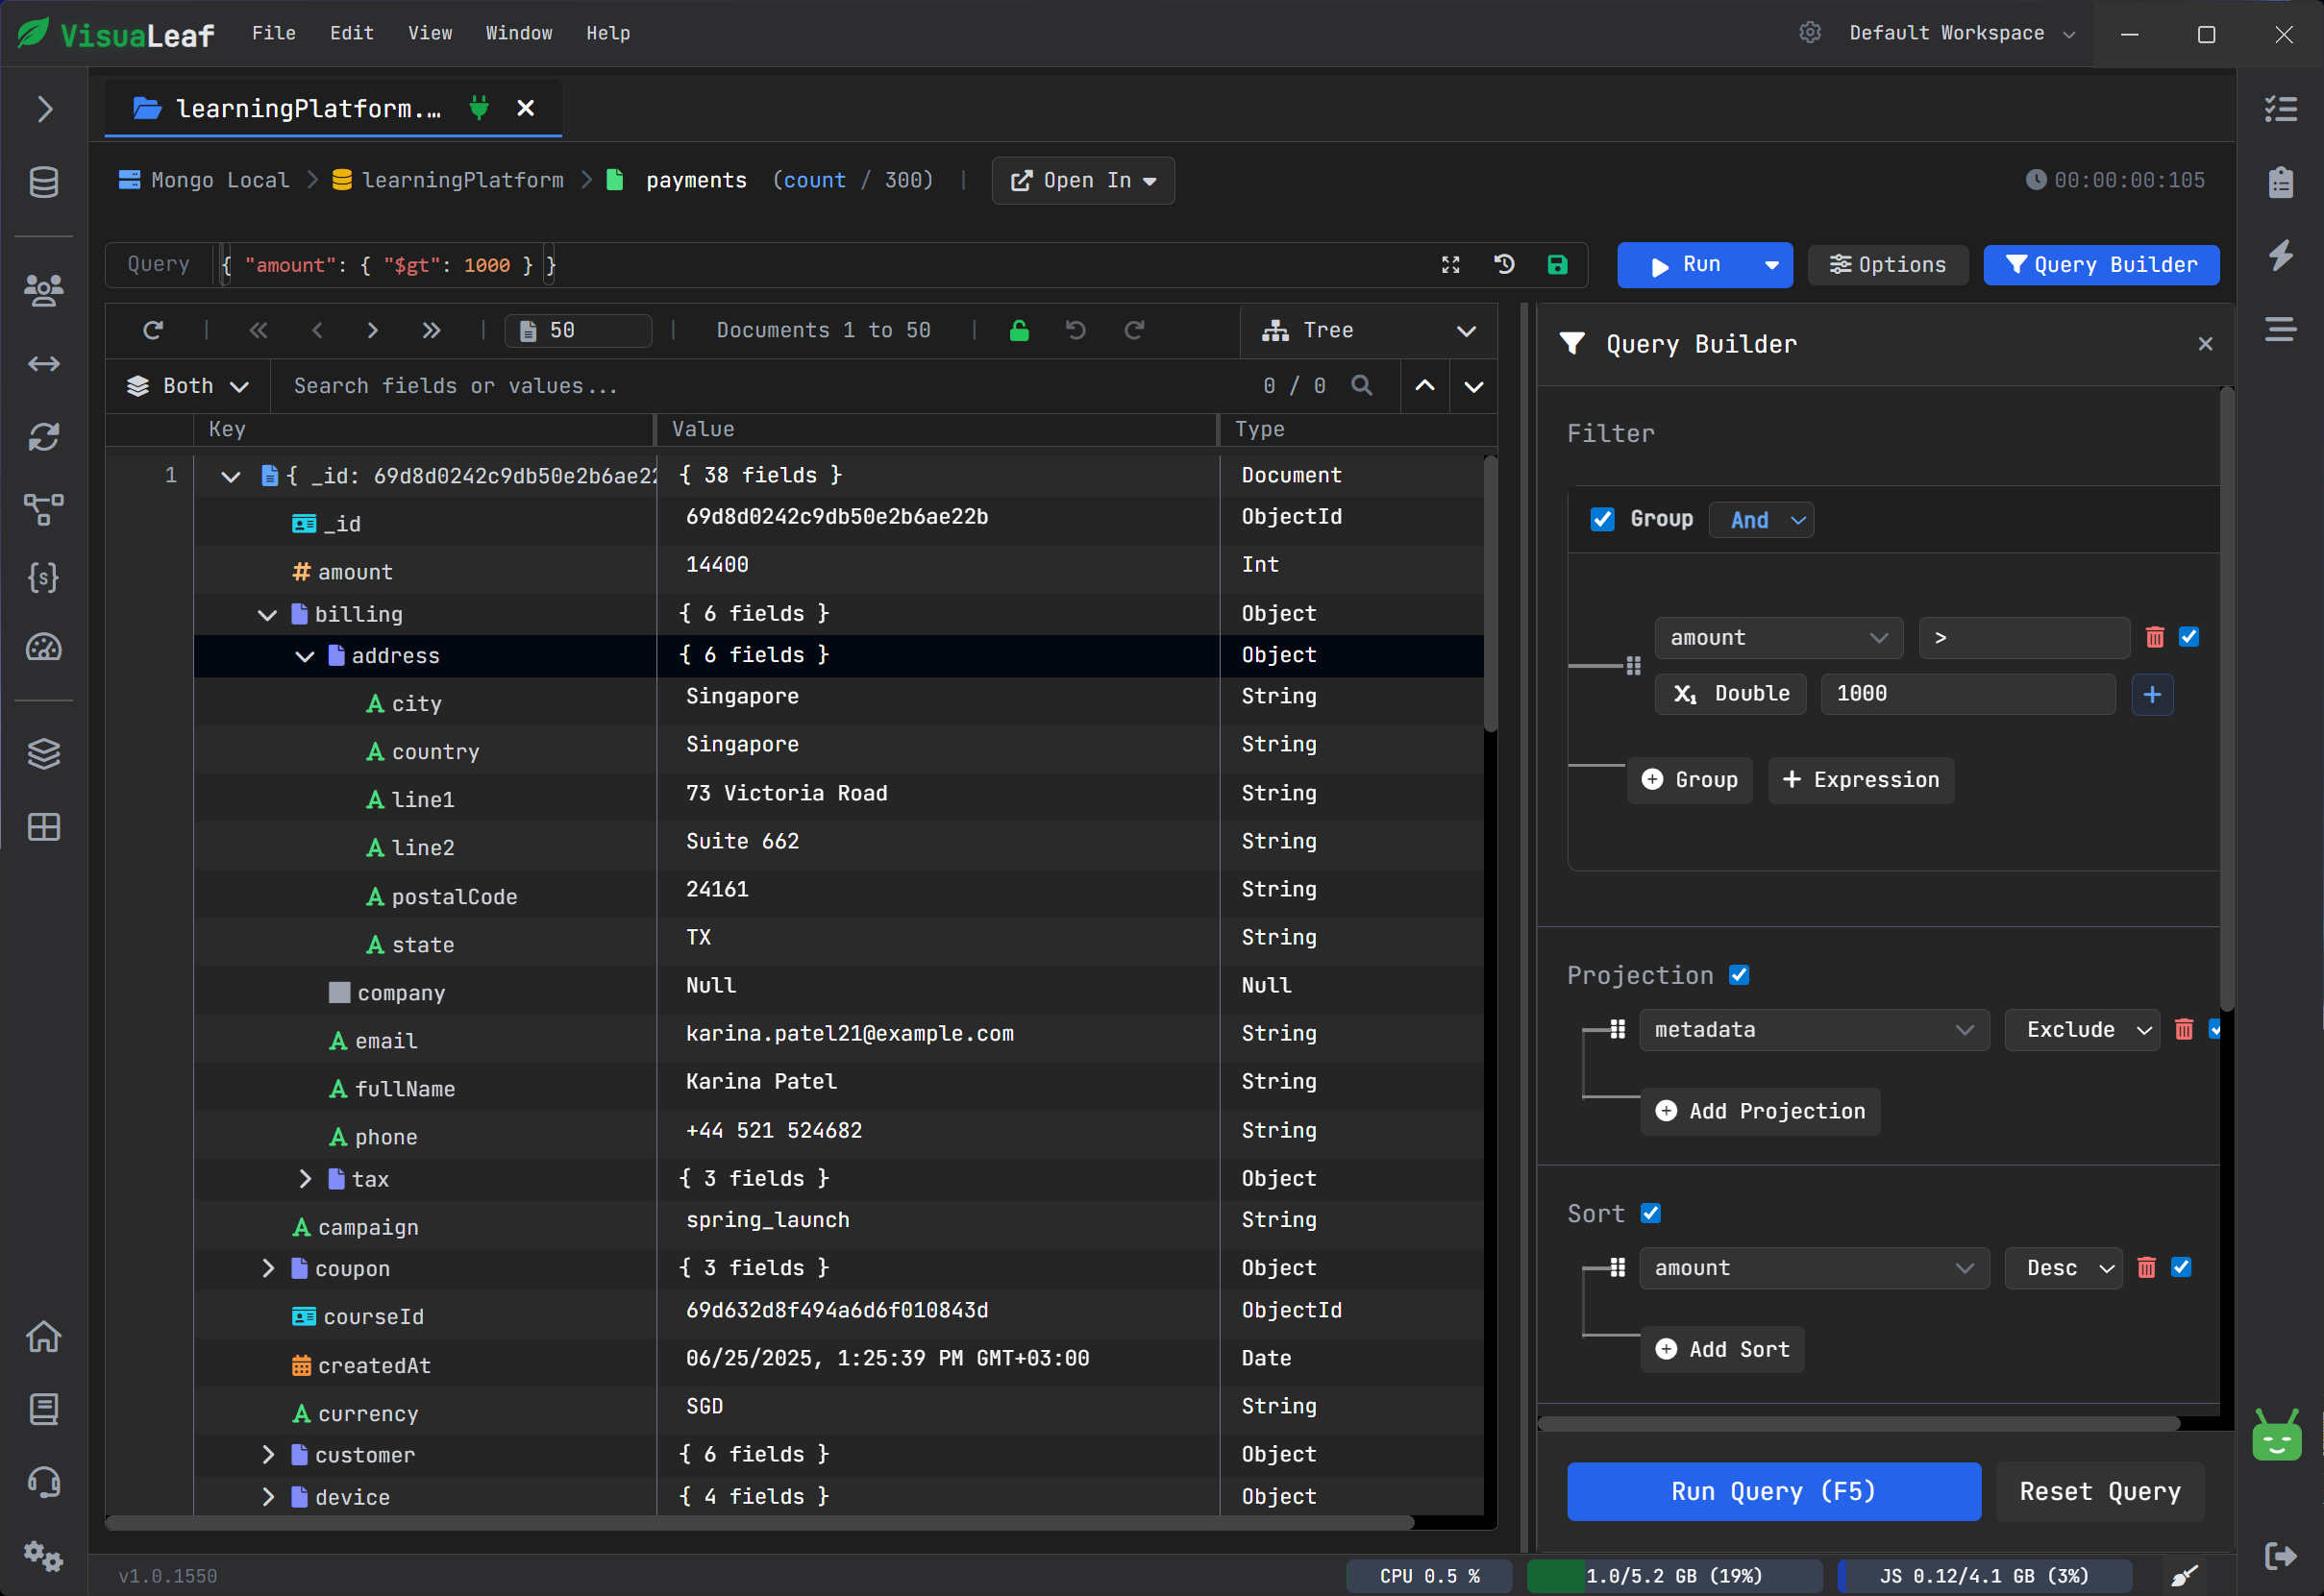
Writing MongoDB queries manually is useful. But when a query has multiple filters, nested fields, sorting, projection, and limits, it is easy to make small mistakes.
VisuaLeaf’s Visual Query Builder helps you build the query step by step.
You choose the field, operator, and value. Then you add sorting, projection, and limit if you need them.
The important part is that you still see the generated MongoDB query.
So you are not locked into a visual interface. You can build visually, test the result, and copy or review the code whenever you need it.
This is helpful for juniors, onboarding, debugging filters, or showing a teammate why a query returns certain documents.
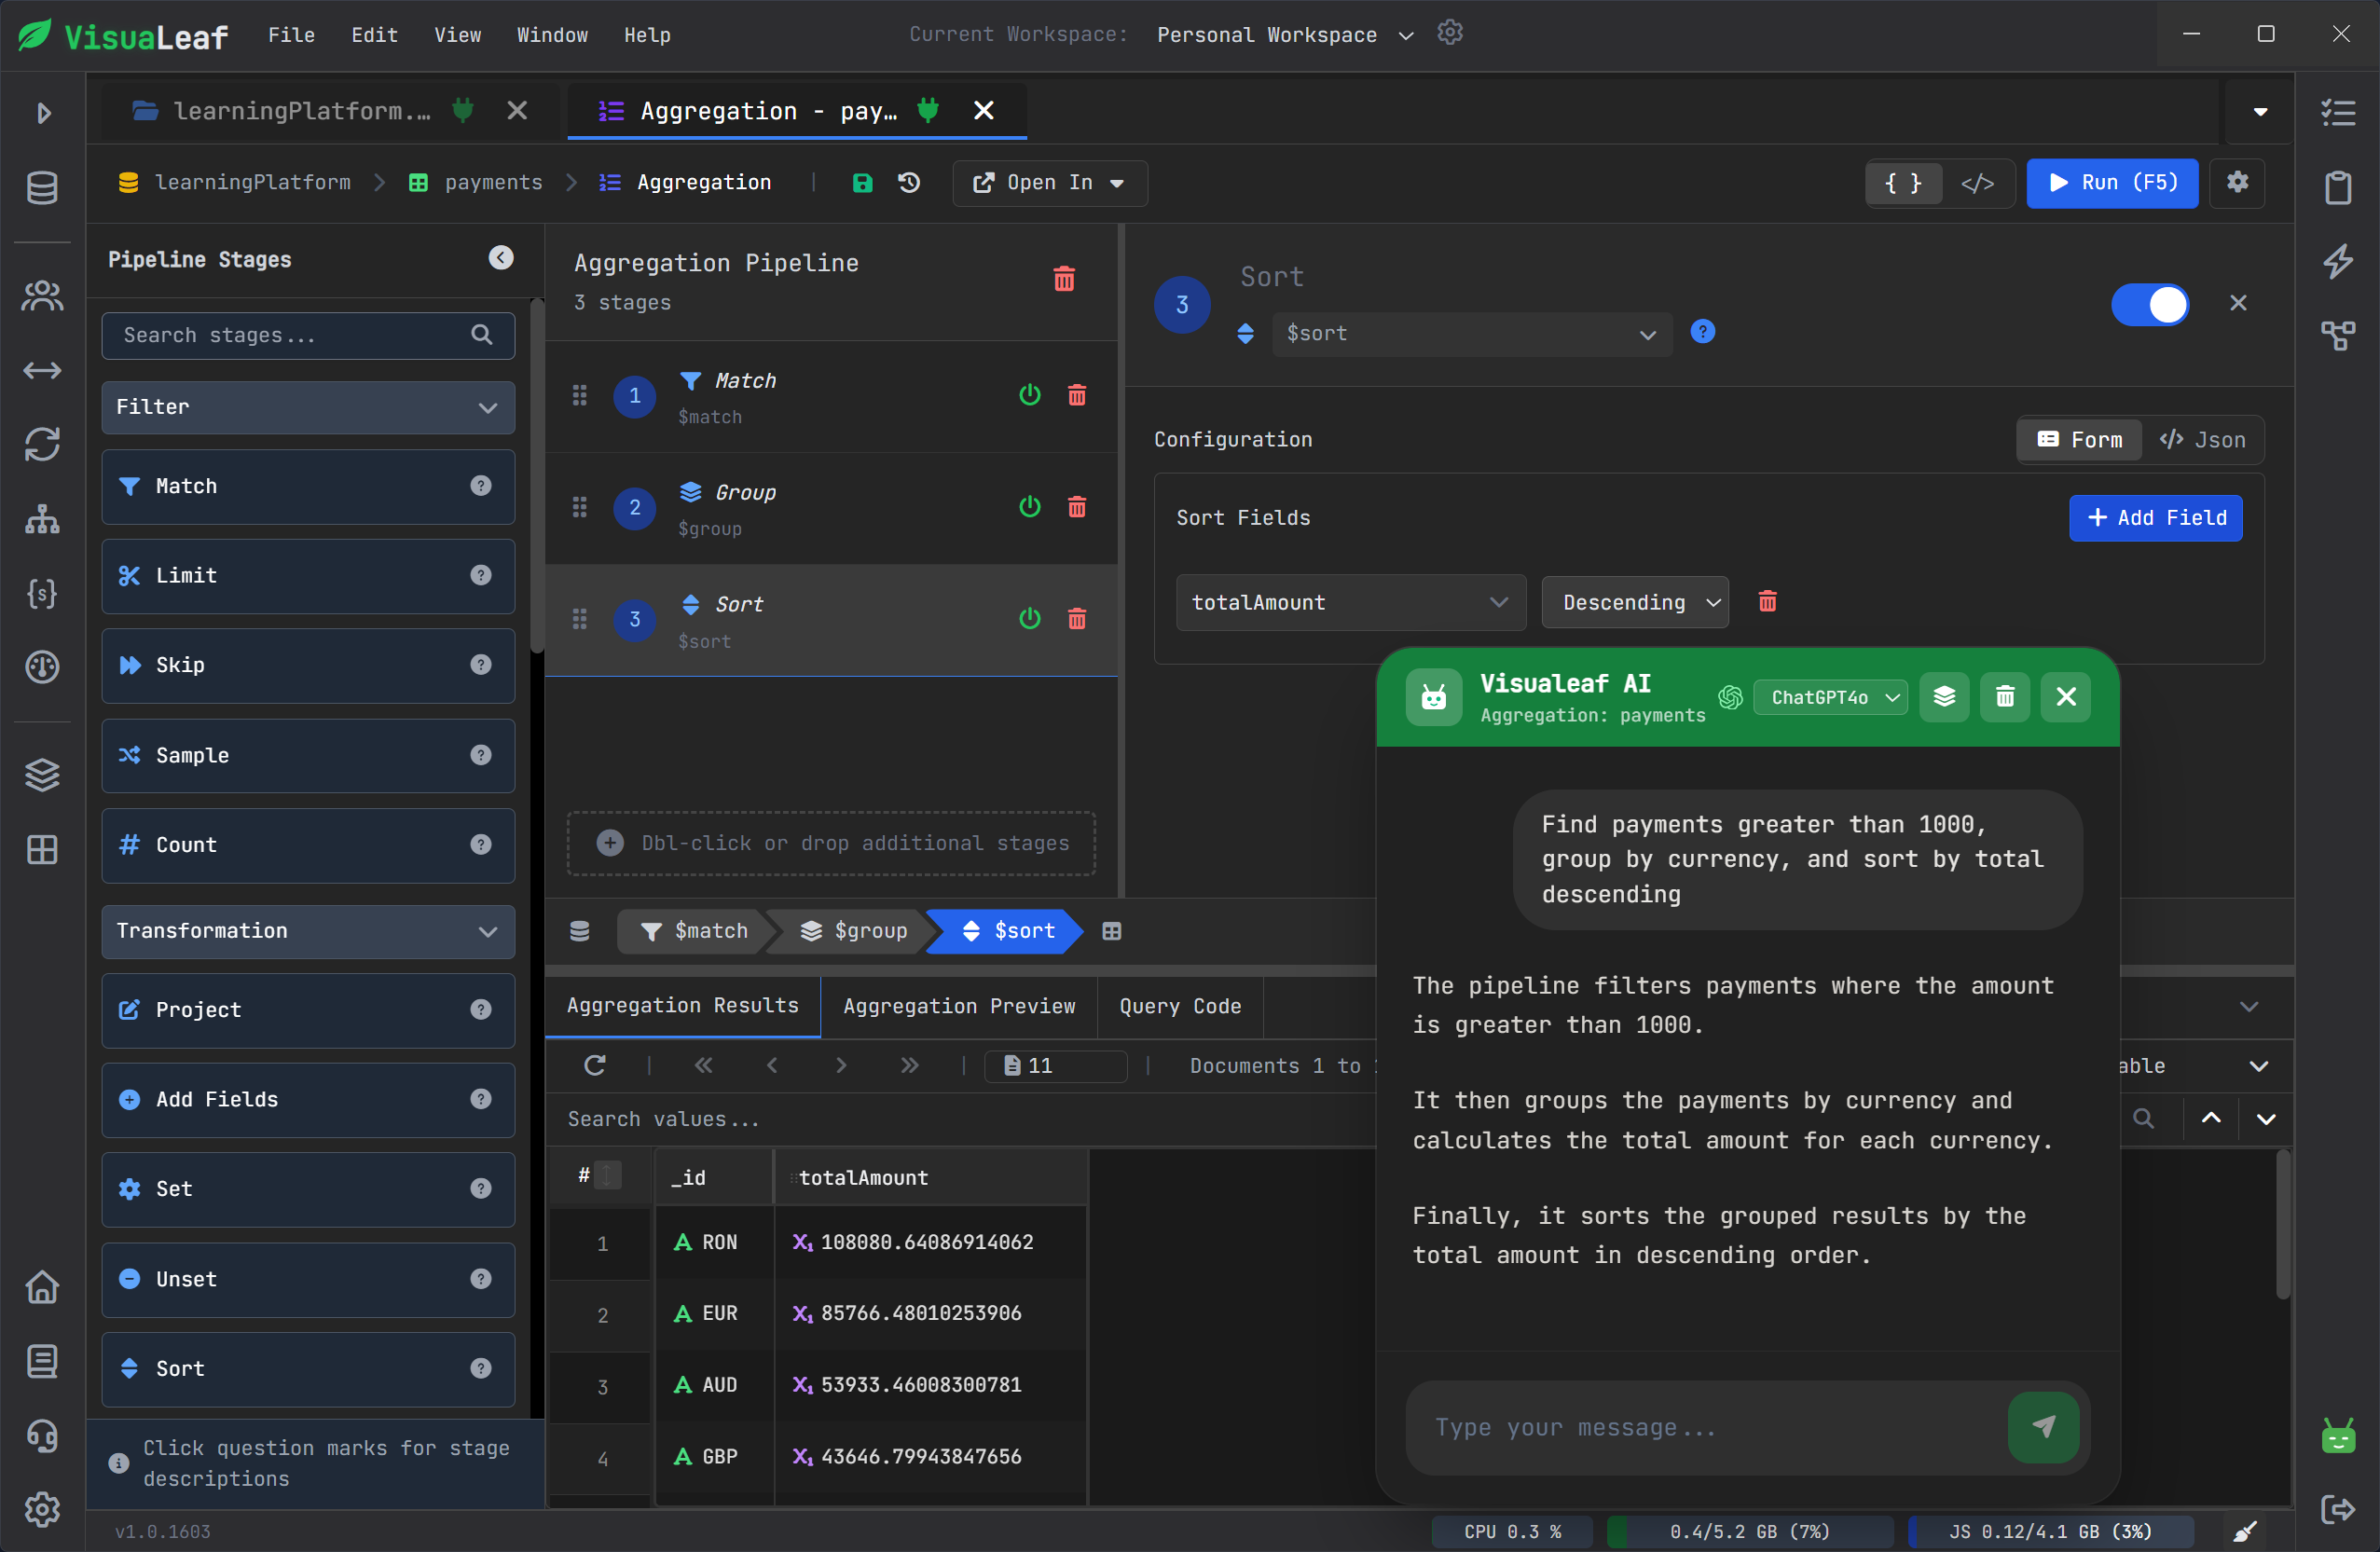
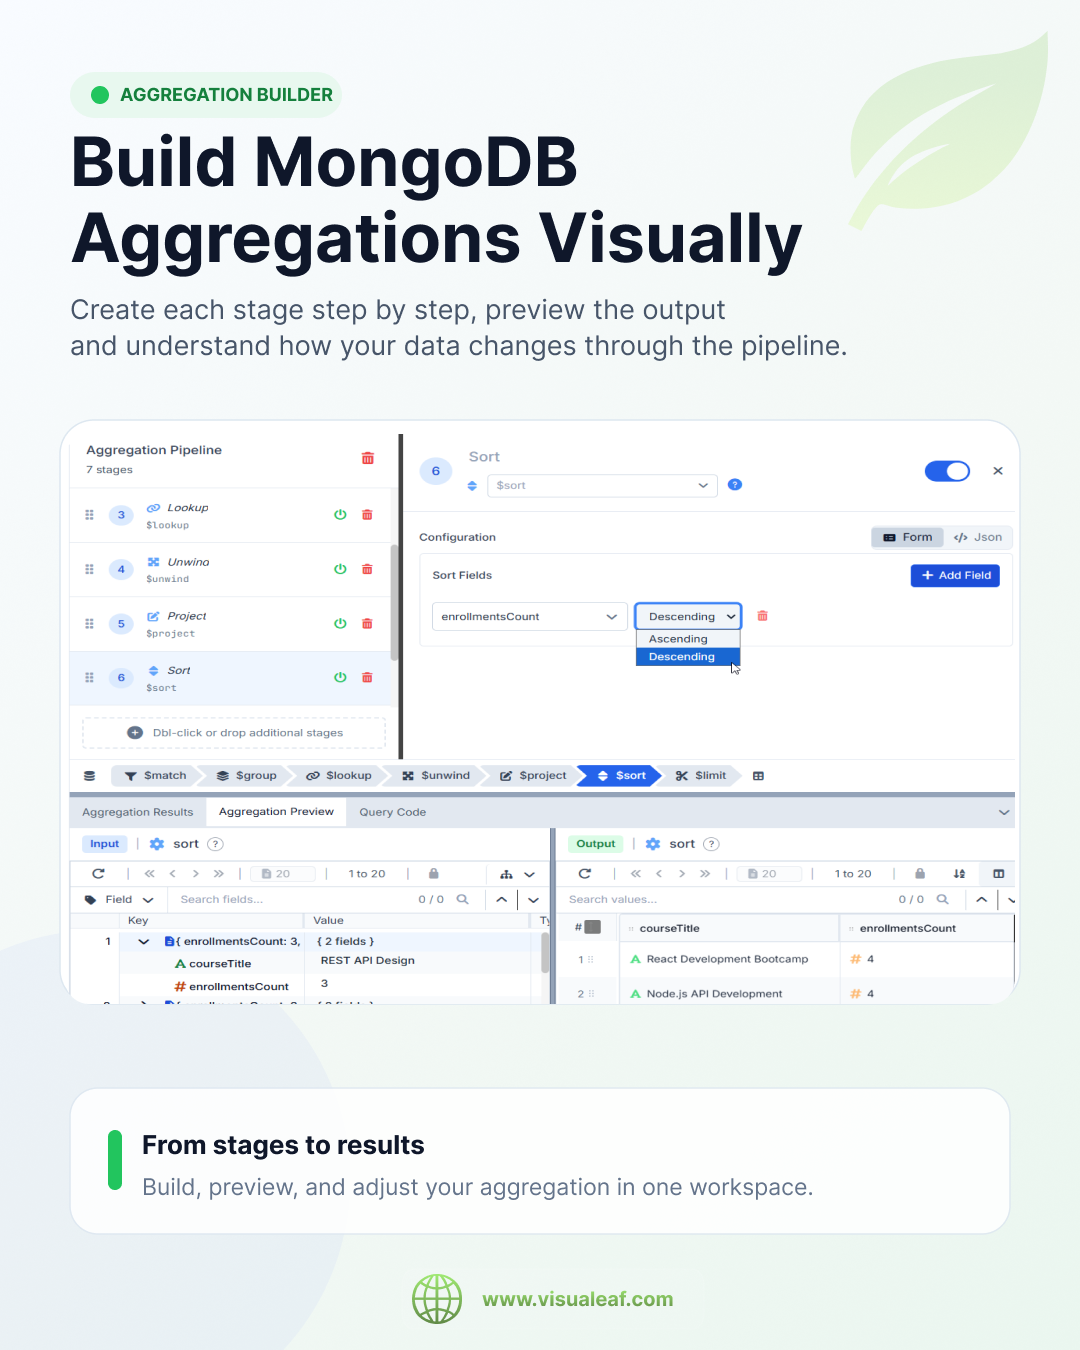
Test aggregation pipelines stage by stage
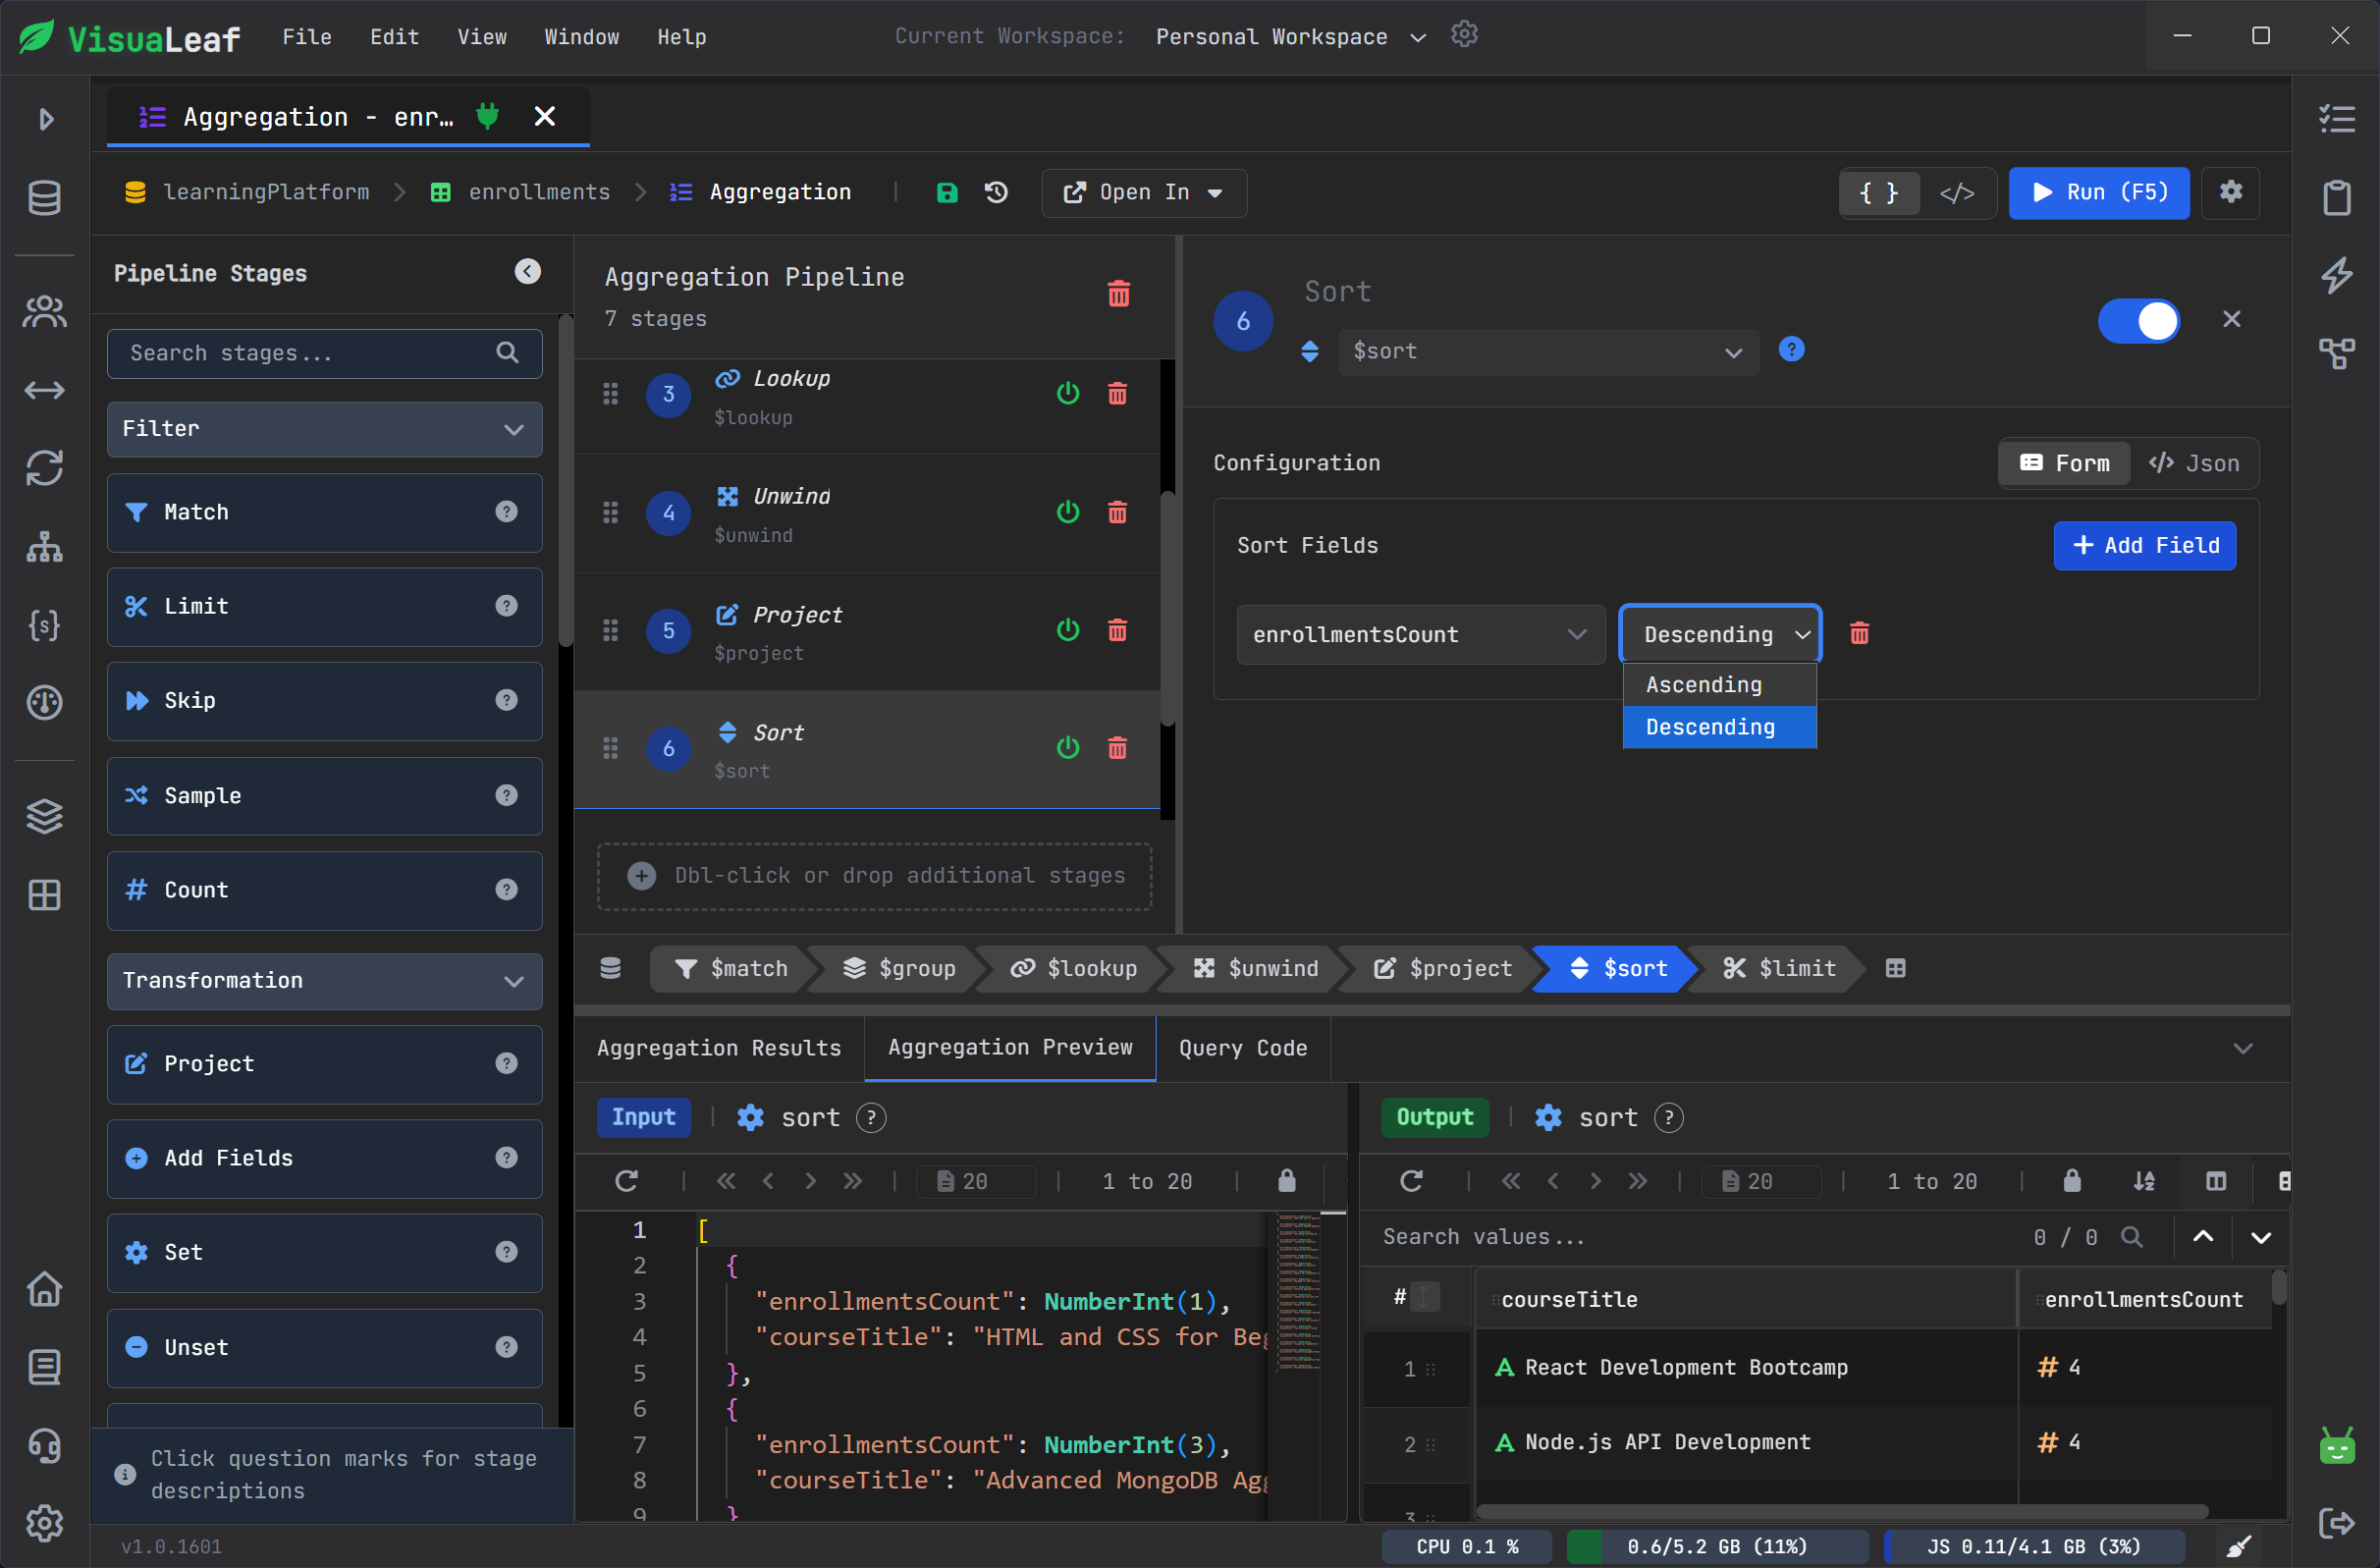
Aggregation pipelines can become hard to read fast.
One $match is fine. A $group is fine. But after $lookup, $unwind, $project, $sort, and more stages, it can be hard to know where the result changed.
VisuaLeaf’s Aggregation Pipeline Builder lets you build pipelines one stage at a time.
You can see the input, add a stage, check the output, and continue from there.
This makes the pipeline easier to debug because you do not have to wait until the final result to notice something is wrong.
It also makes aggregations easier to explain during teamwork, because each stage has a clear role.
You still get the generated aggregation code, so the visual builder helps you understand the pipeline instead of hiding it.
Use AI Assistant when you need a faster starting point
Sometimes you know what you want from the data, but you do not want to start from zero.
In VisuaLeaf, you can use AI Assistant while working with the Visual Query Builder or the Aggregation Pipeline Builder.
It can help generate a first query or pipeline from your prompt. Then you can review the result, test it with your data, adjust it visually, and keep the generated MongoDB code visible.
AI Assistant gives you a faster starting point, but you still stay in control of the final result.
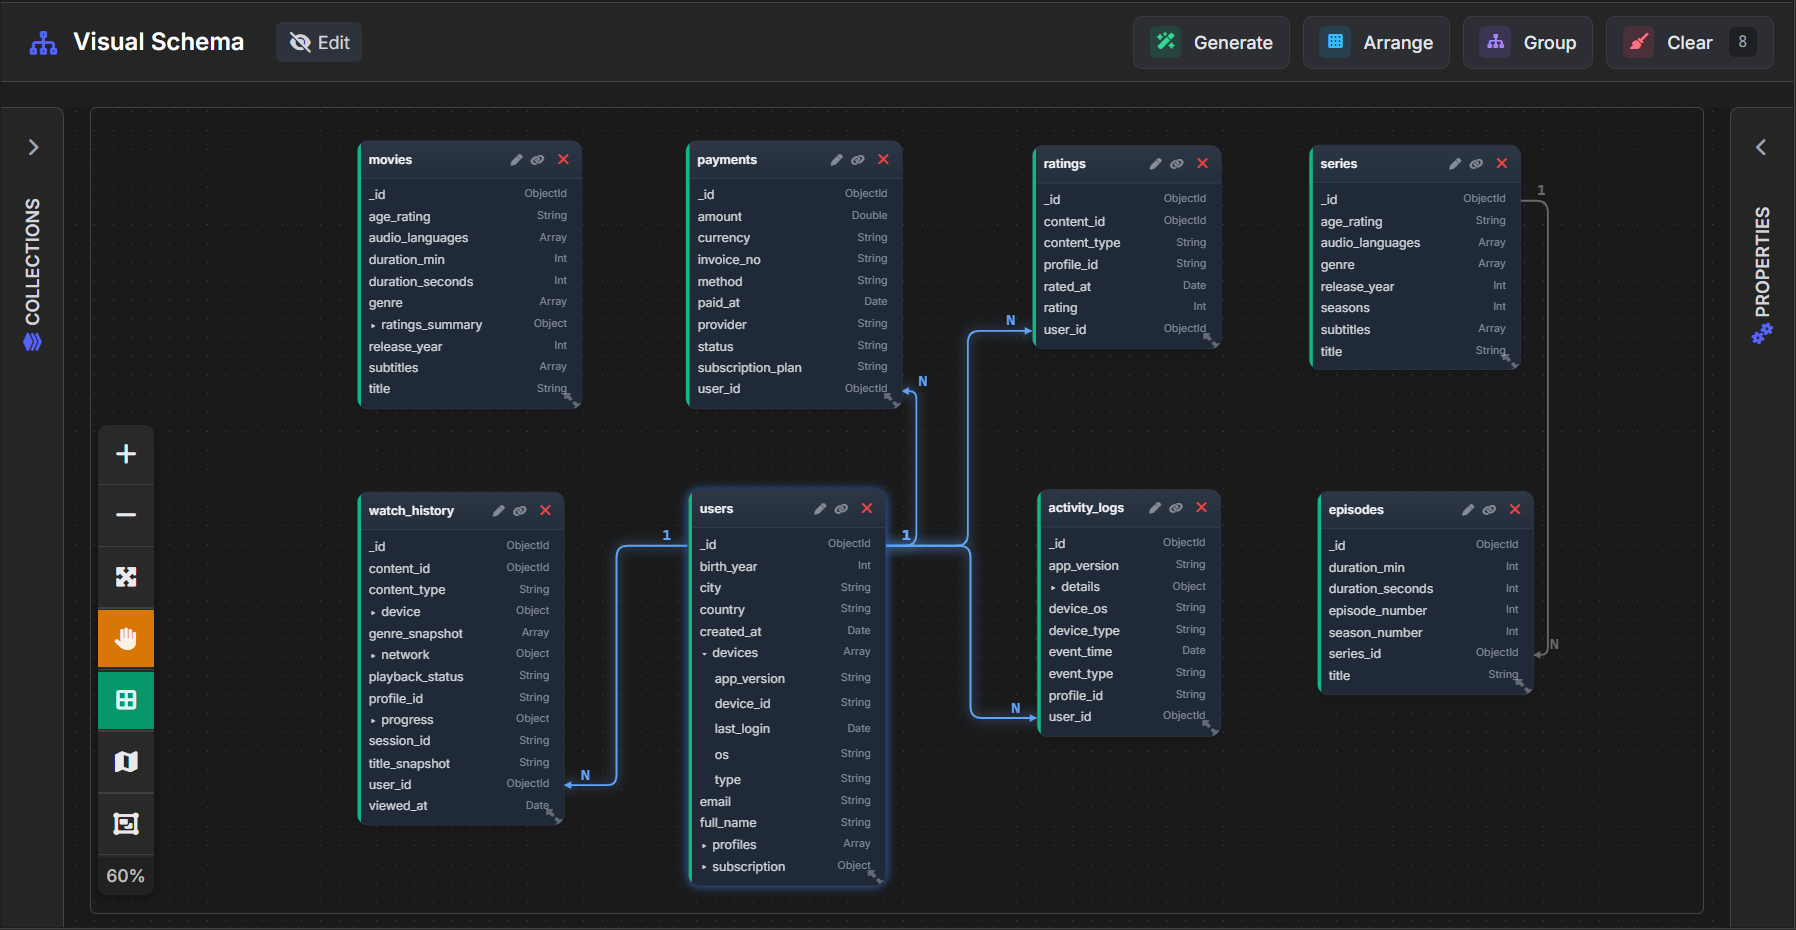
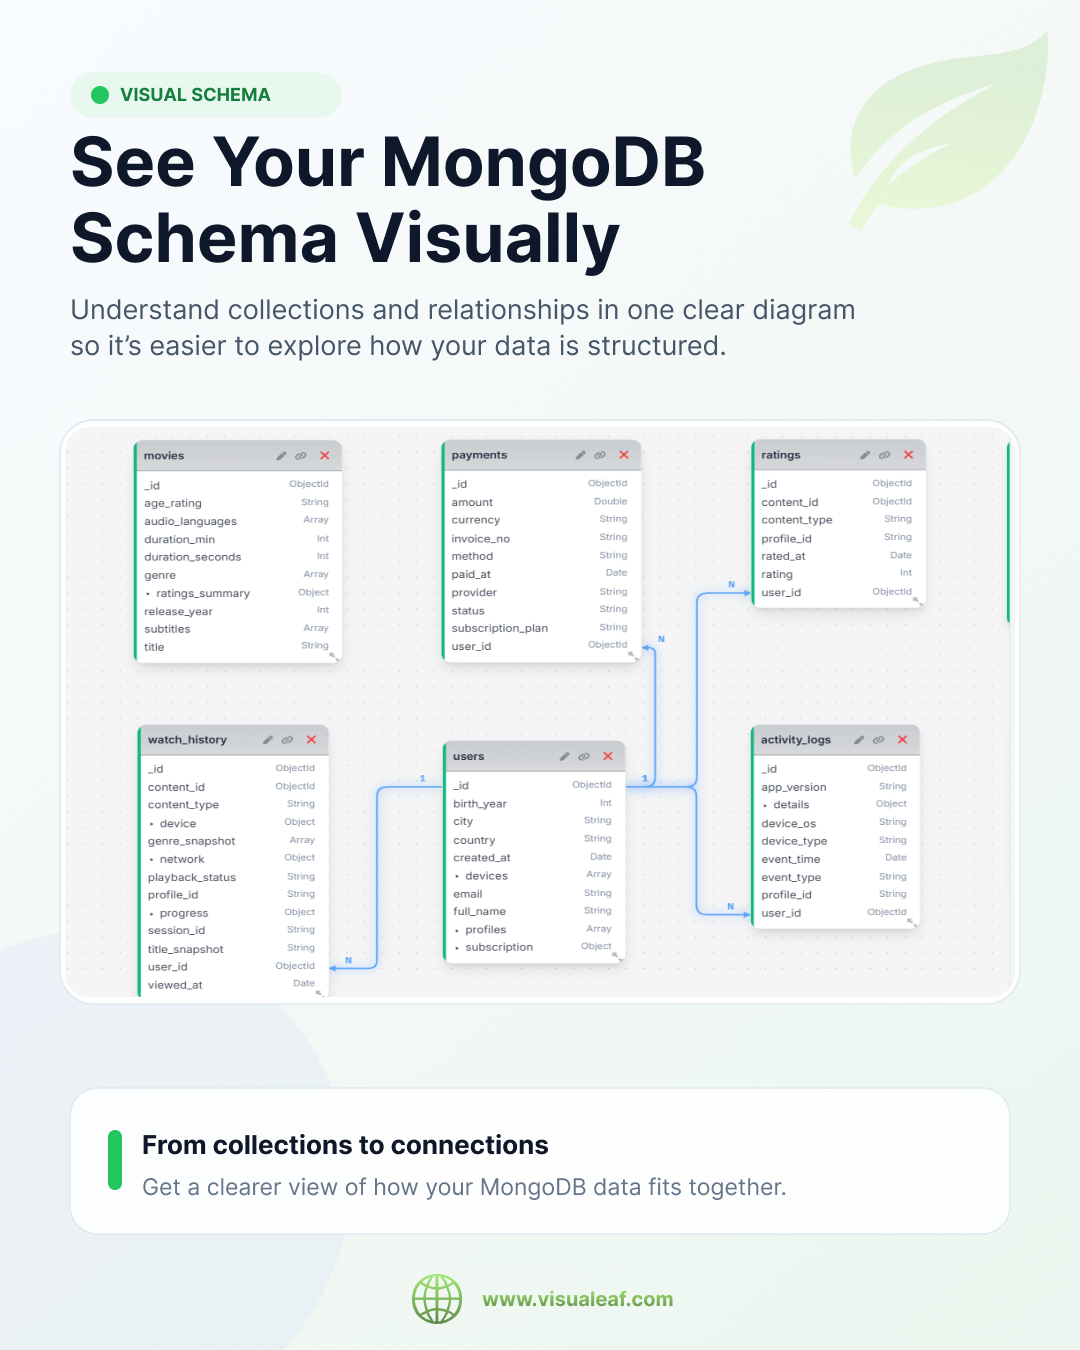
Understand NoSQL schemas with diagrams
MongoDB is flexible, but flexible does not mean structure does not exist.
The structure is still there. It is inside the documents.
You may have required fields, optional fields, nested objects, arrays, embedded documents, and references between collections.
VisuaLeaf’s Schema Designer helps you see that structure visually.
This is useful when you join a new project, prepare documentation, explain the database to another developer, or try to understand how collections are connected.
A schema diagram can make a MongoDB database easier to understand than reading documents one by one.
This is especially helpful for teams, because not everyone has the same database knowledge in their head.
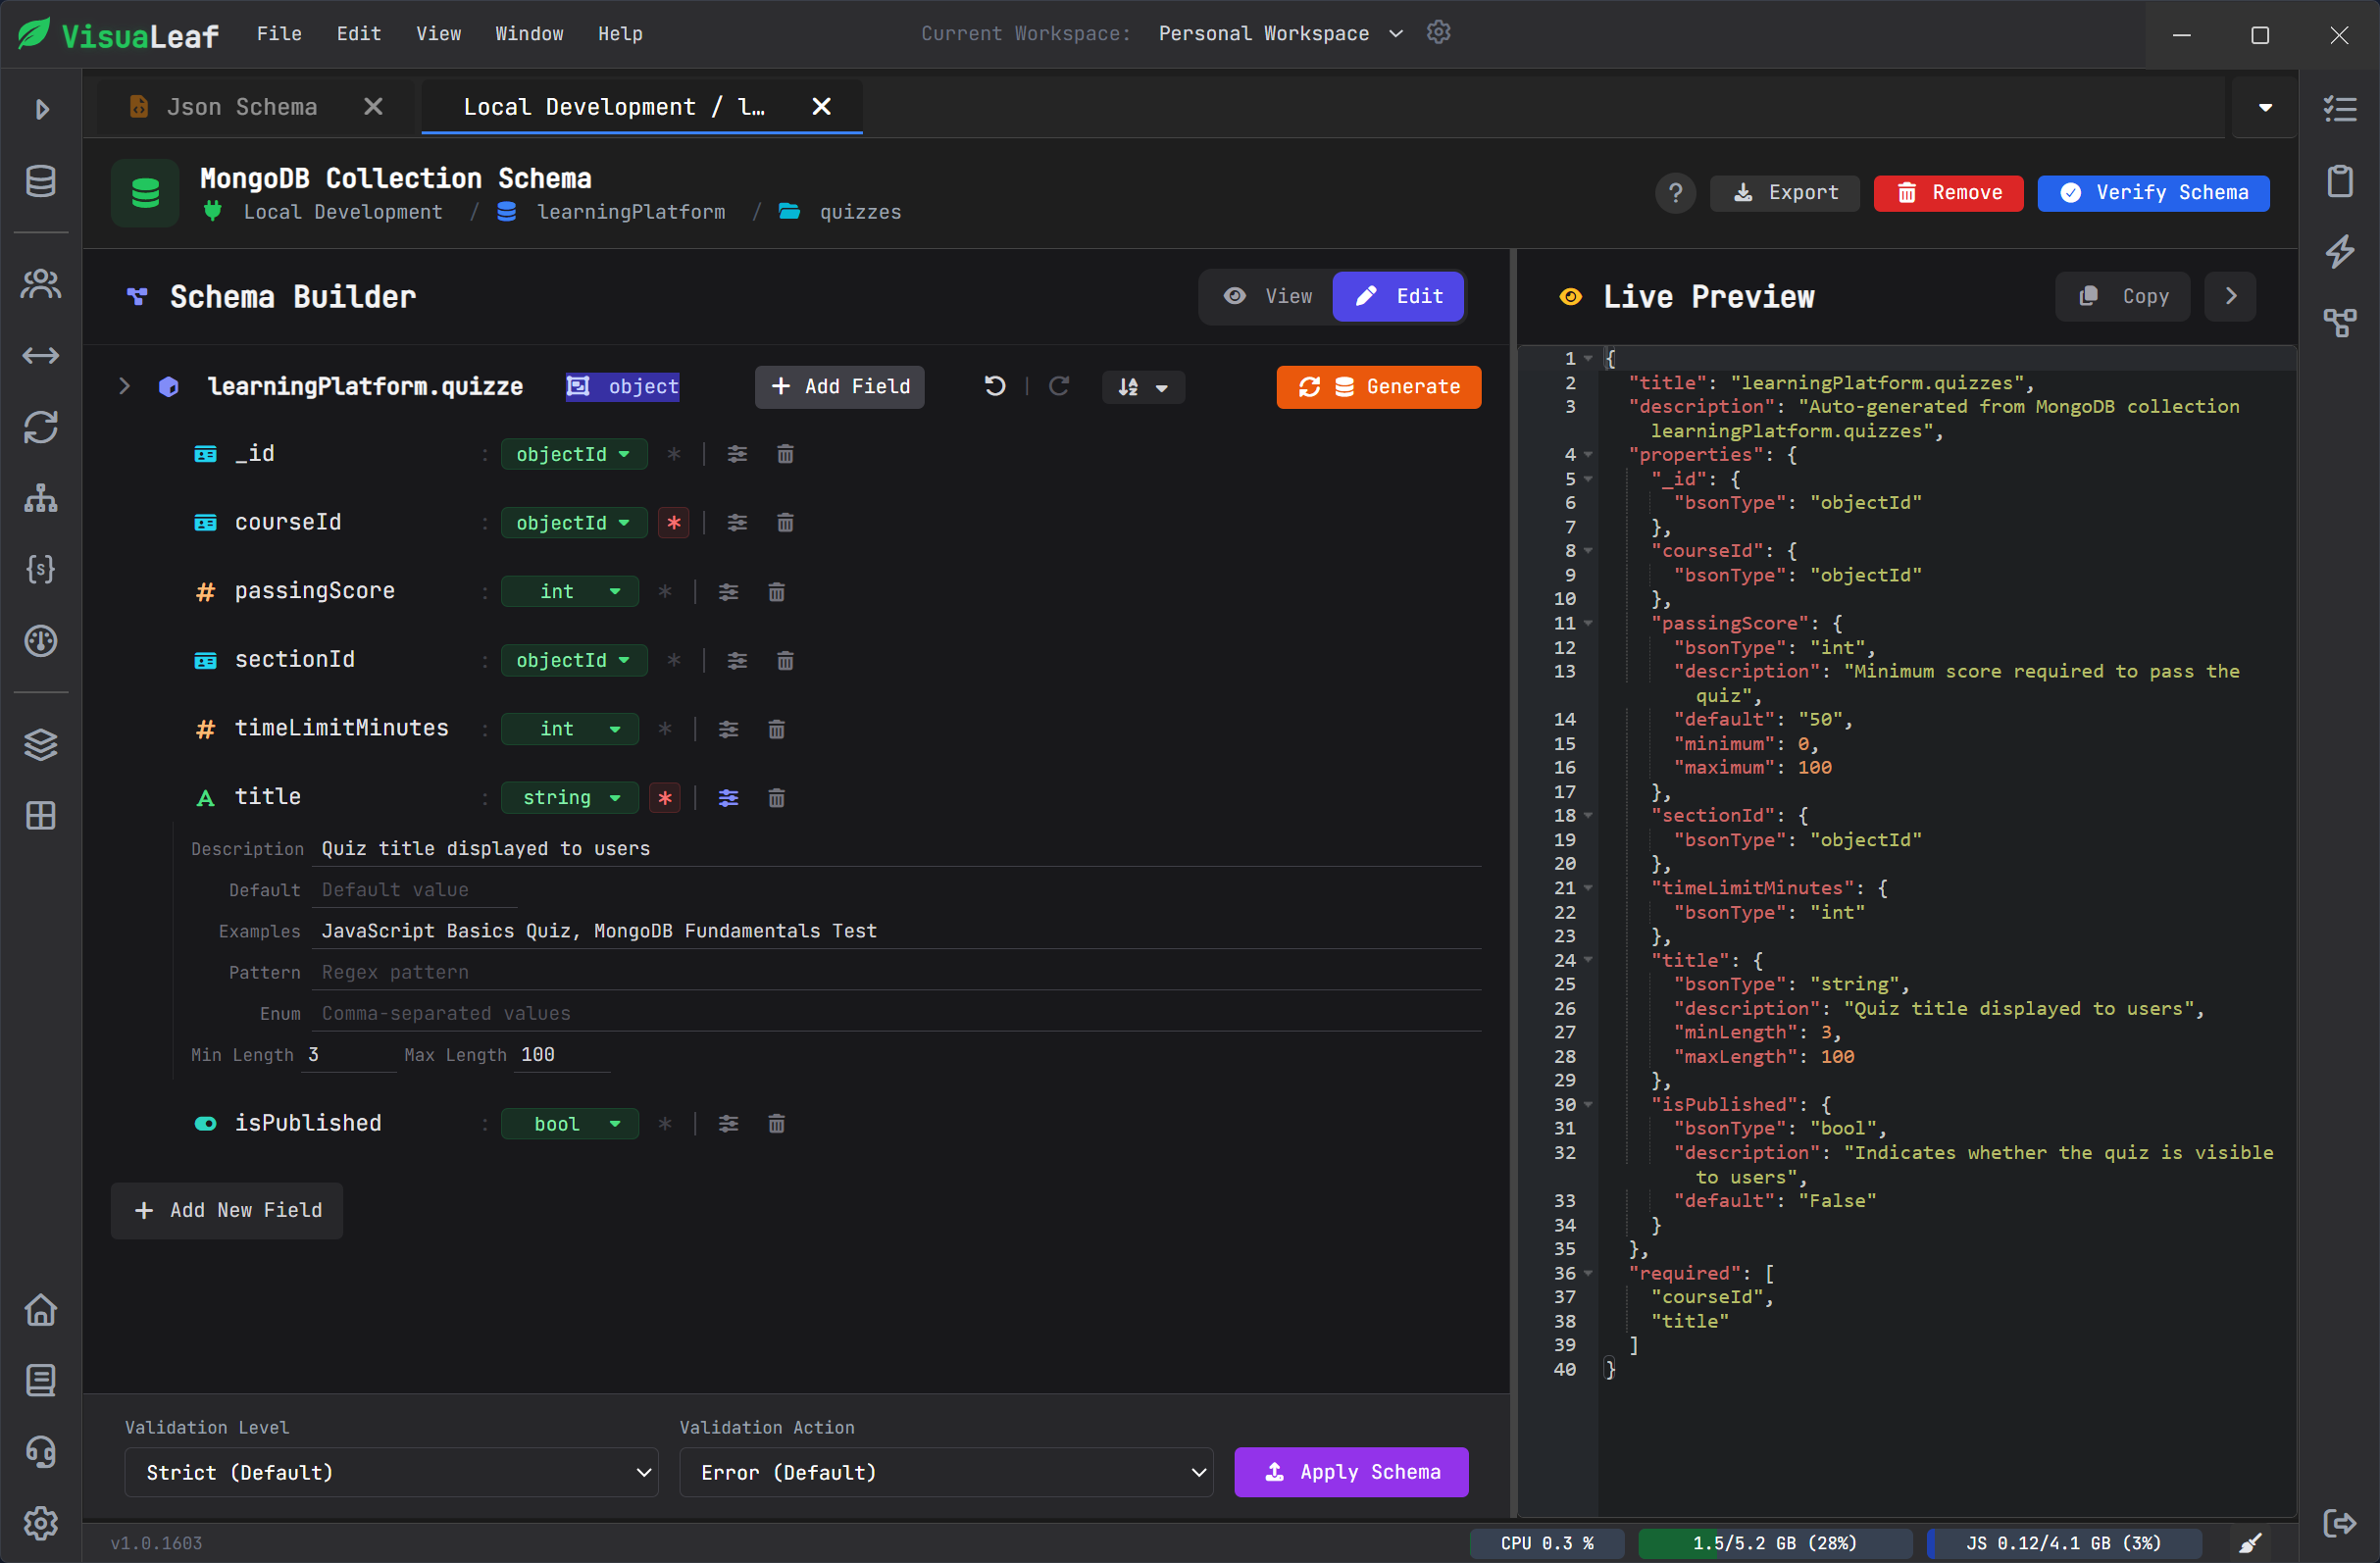
Use JSON Schema Validation when you need to enforce structure
MongoDB is flexible by default, but some collections need stricter rules.
For example, you may want to require important fields, accept only specific data types, or make sure documents follow the same structure before they are inserted.
VisuaLeaf’s JSON Schema Validation helps you define MongoDB validation rules visually.
You can enforce structure where it matters, prevent bad data, and still see the generated JSON Schema validation code.
This is useful when a collection is used by a team, an app, or any workflow where inconsistent data can create problems later.
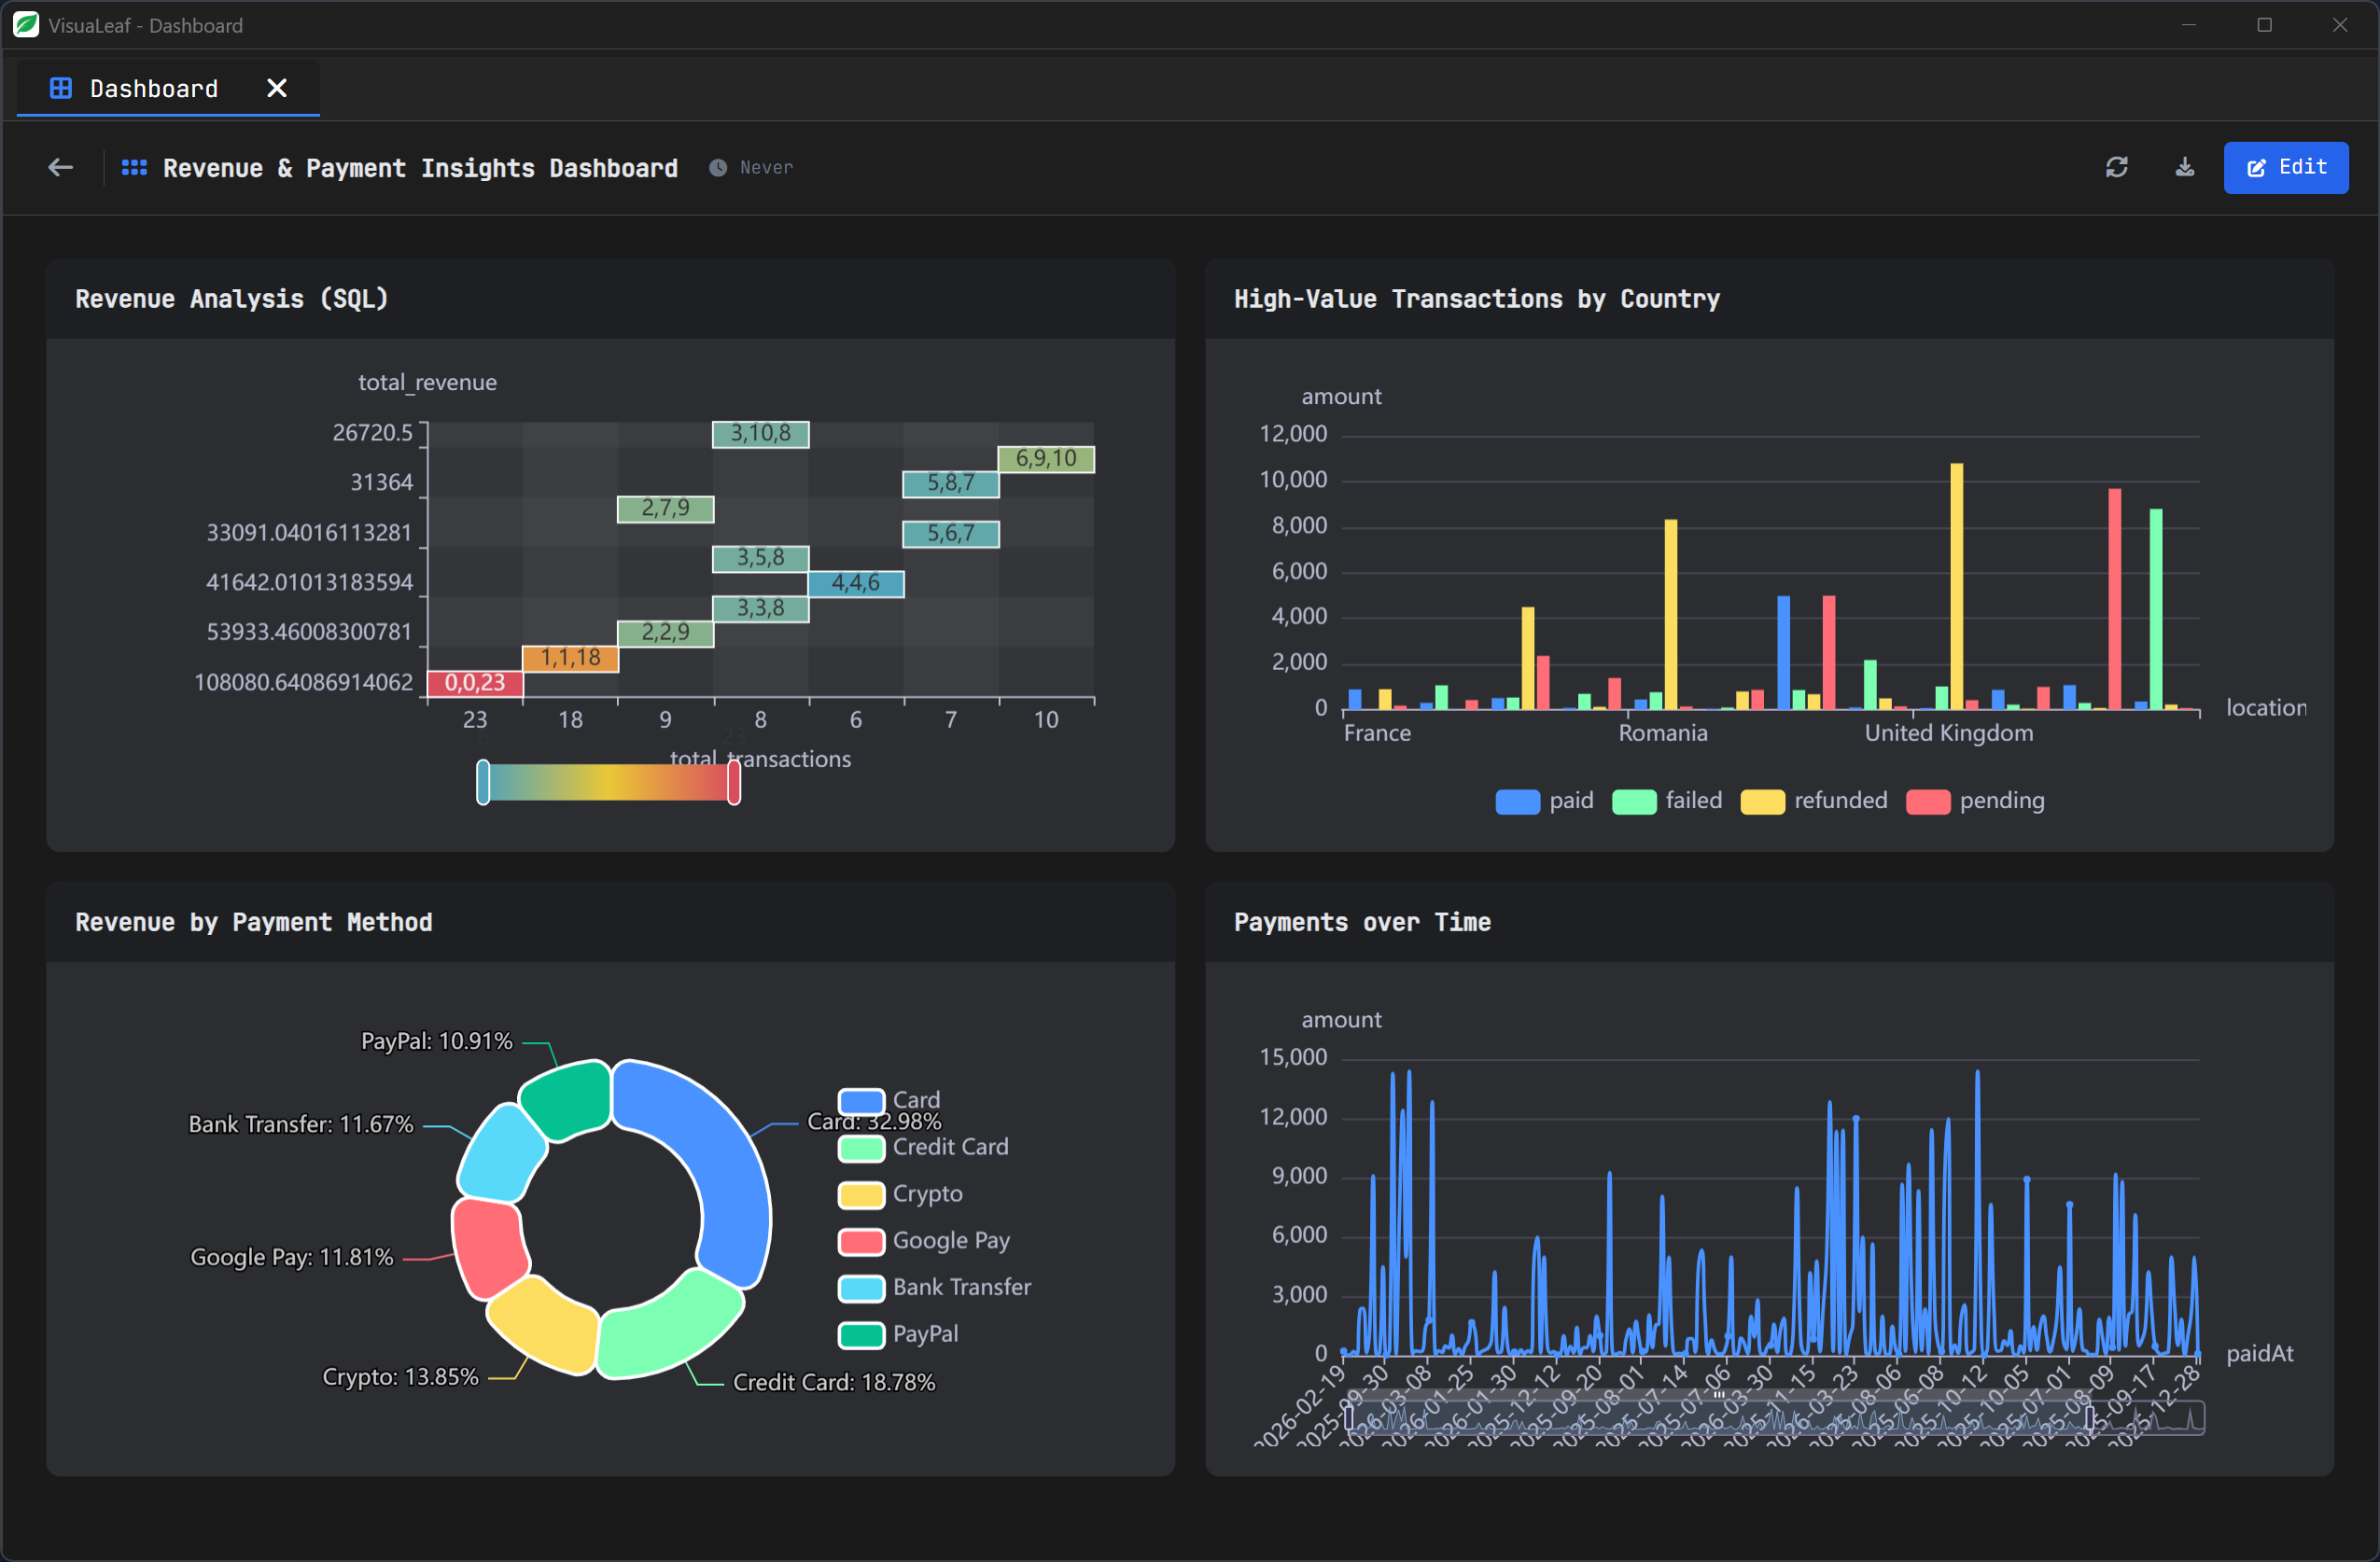
Create charts and dashboards from MongoDB data
Some MongoDB data is easier to understand visually.
With VisuaLeaf’s Chart & Dashboard Builder, you can turn collection data into charts and group multiple views in one dashboard.
This is useful for payments by status, orders by month, users by plan, expenses by category, or any data you want to understand faster.
Charts and dashboards help you prepare demos, create quick internal reports, check product data, or explain results to people who do not want to read raw JSON documents.
You can keep the visual data close to the collections, queries, and aggregations you are already working with.
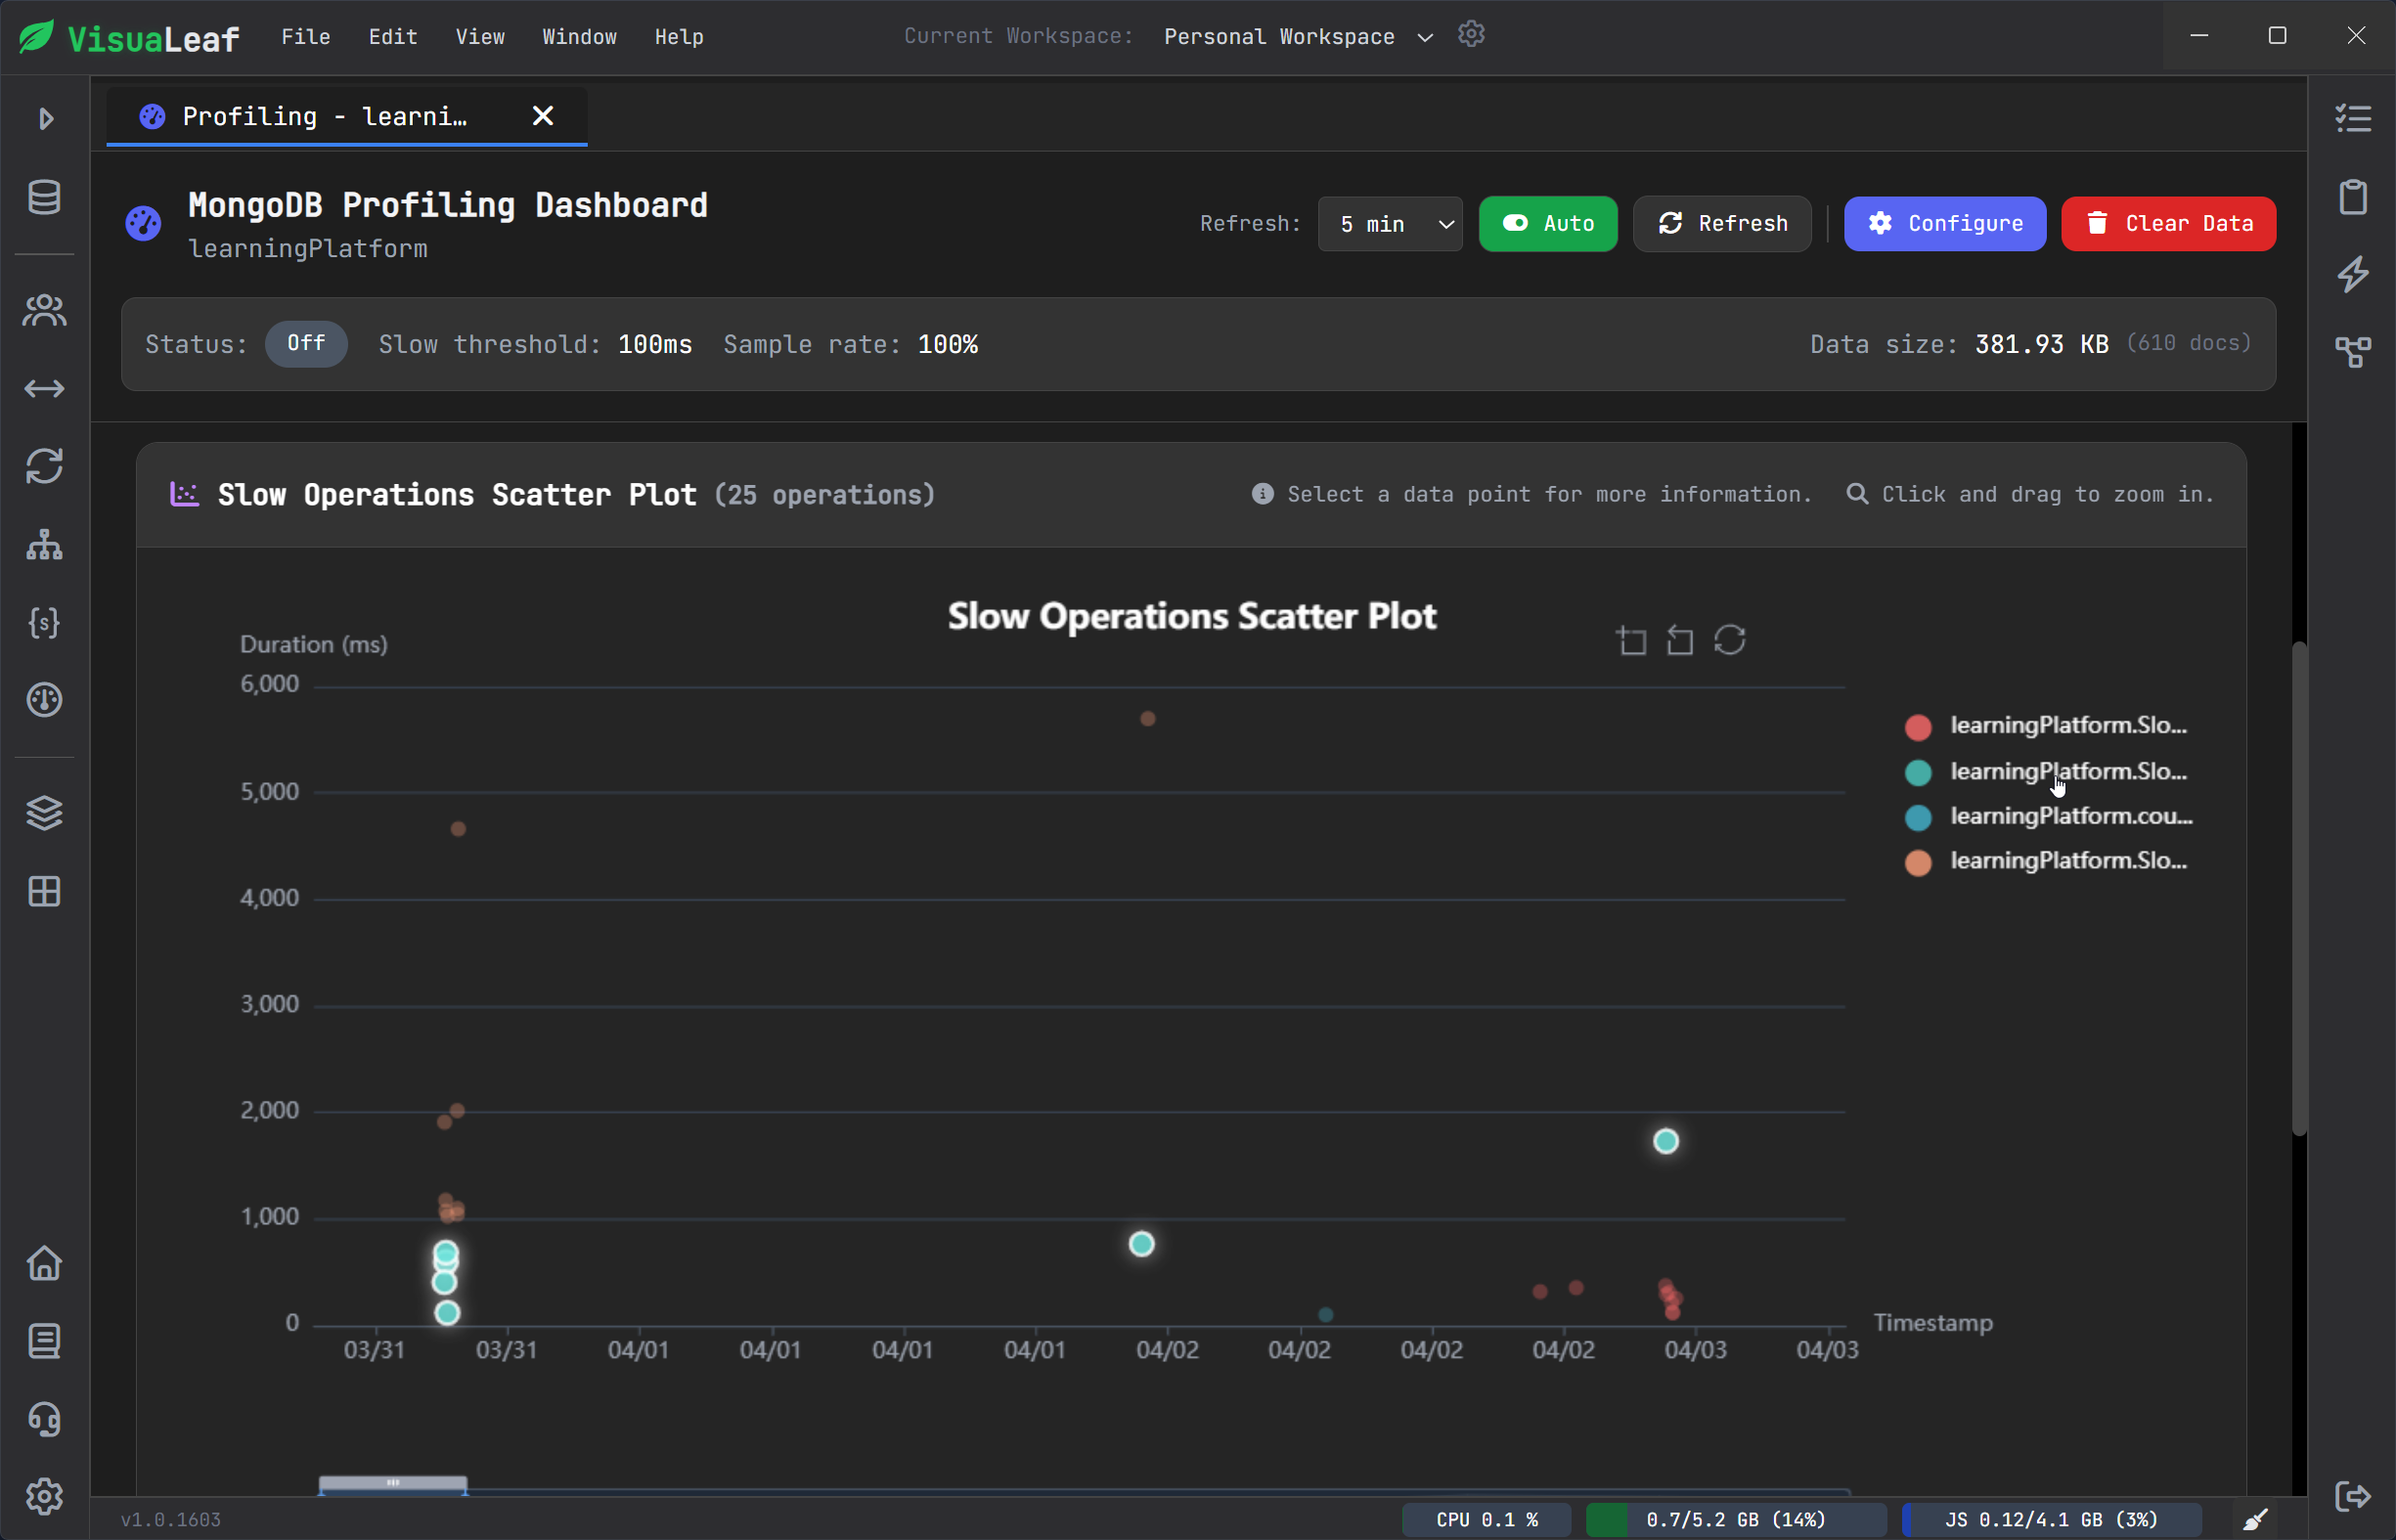
Check query performance with Explain and Profiler
When a MongoDB query is slow, you need more than a guess.
You need to know if MongoDB is using an index, scanning too many documents, or doing a collection scan.
VisuaLeaf includes tools like Explain Plan and Query Profiler to help you understand what happens behind a query.
You can check execution details, scanned documents, returned documents, and index usage closer to the query itself.
This makes performance work easier because you do not have to separate query building from query debugging.
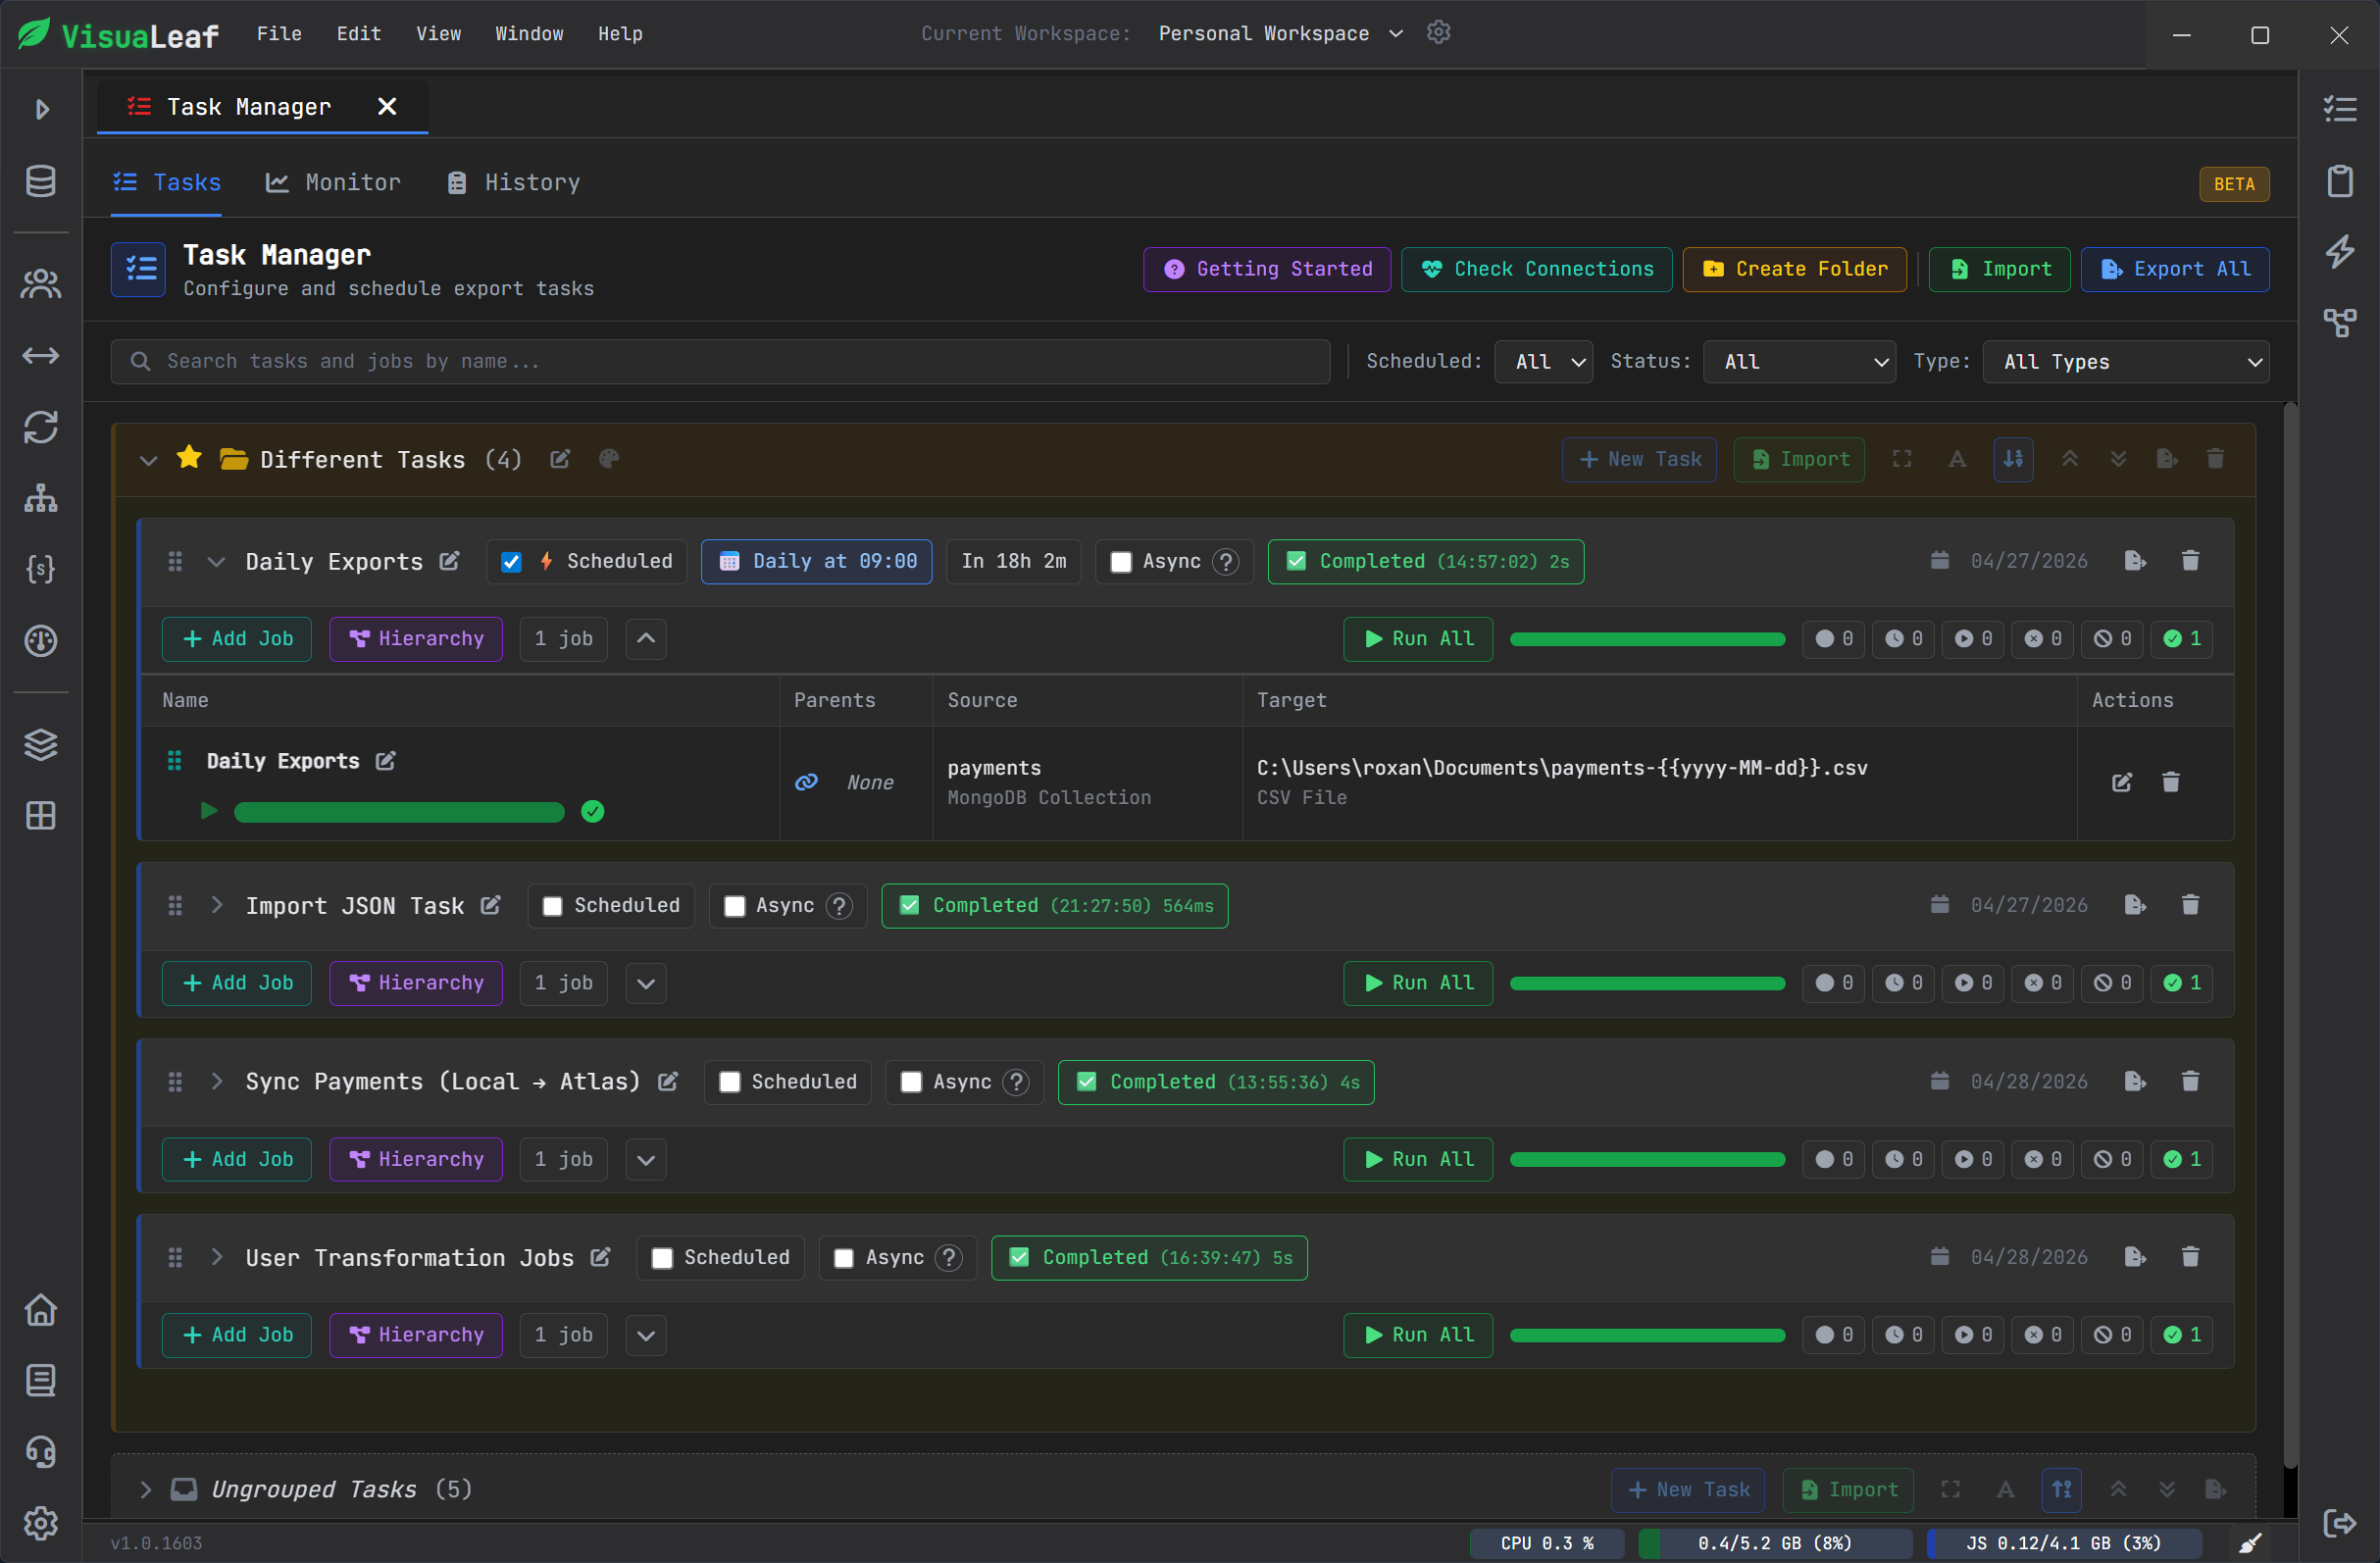
Automate MongoDB tasks with Task Manager
Some MongoDB work does not need to be done manually every time.
With VisuaLeaf’s Task Manager, you can create and run tasks directly from the workspace.
This is useful for repeated actions like running scripts, exporting data, syncing workflows, or handling MongoDB operations that you do not want to rebuild from zero each time.
Instead of keeping these tasks in different places, you can manage them closer to the collections, queries, and tools you already use.
For teams, this makes repeated MongoDB work easier to organize, run, and review.
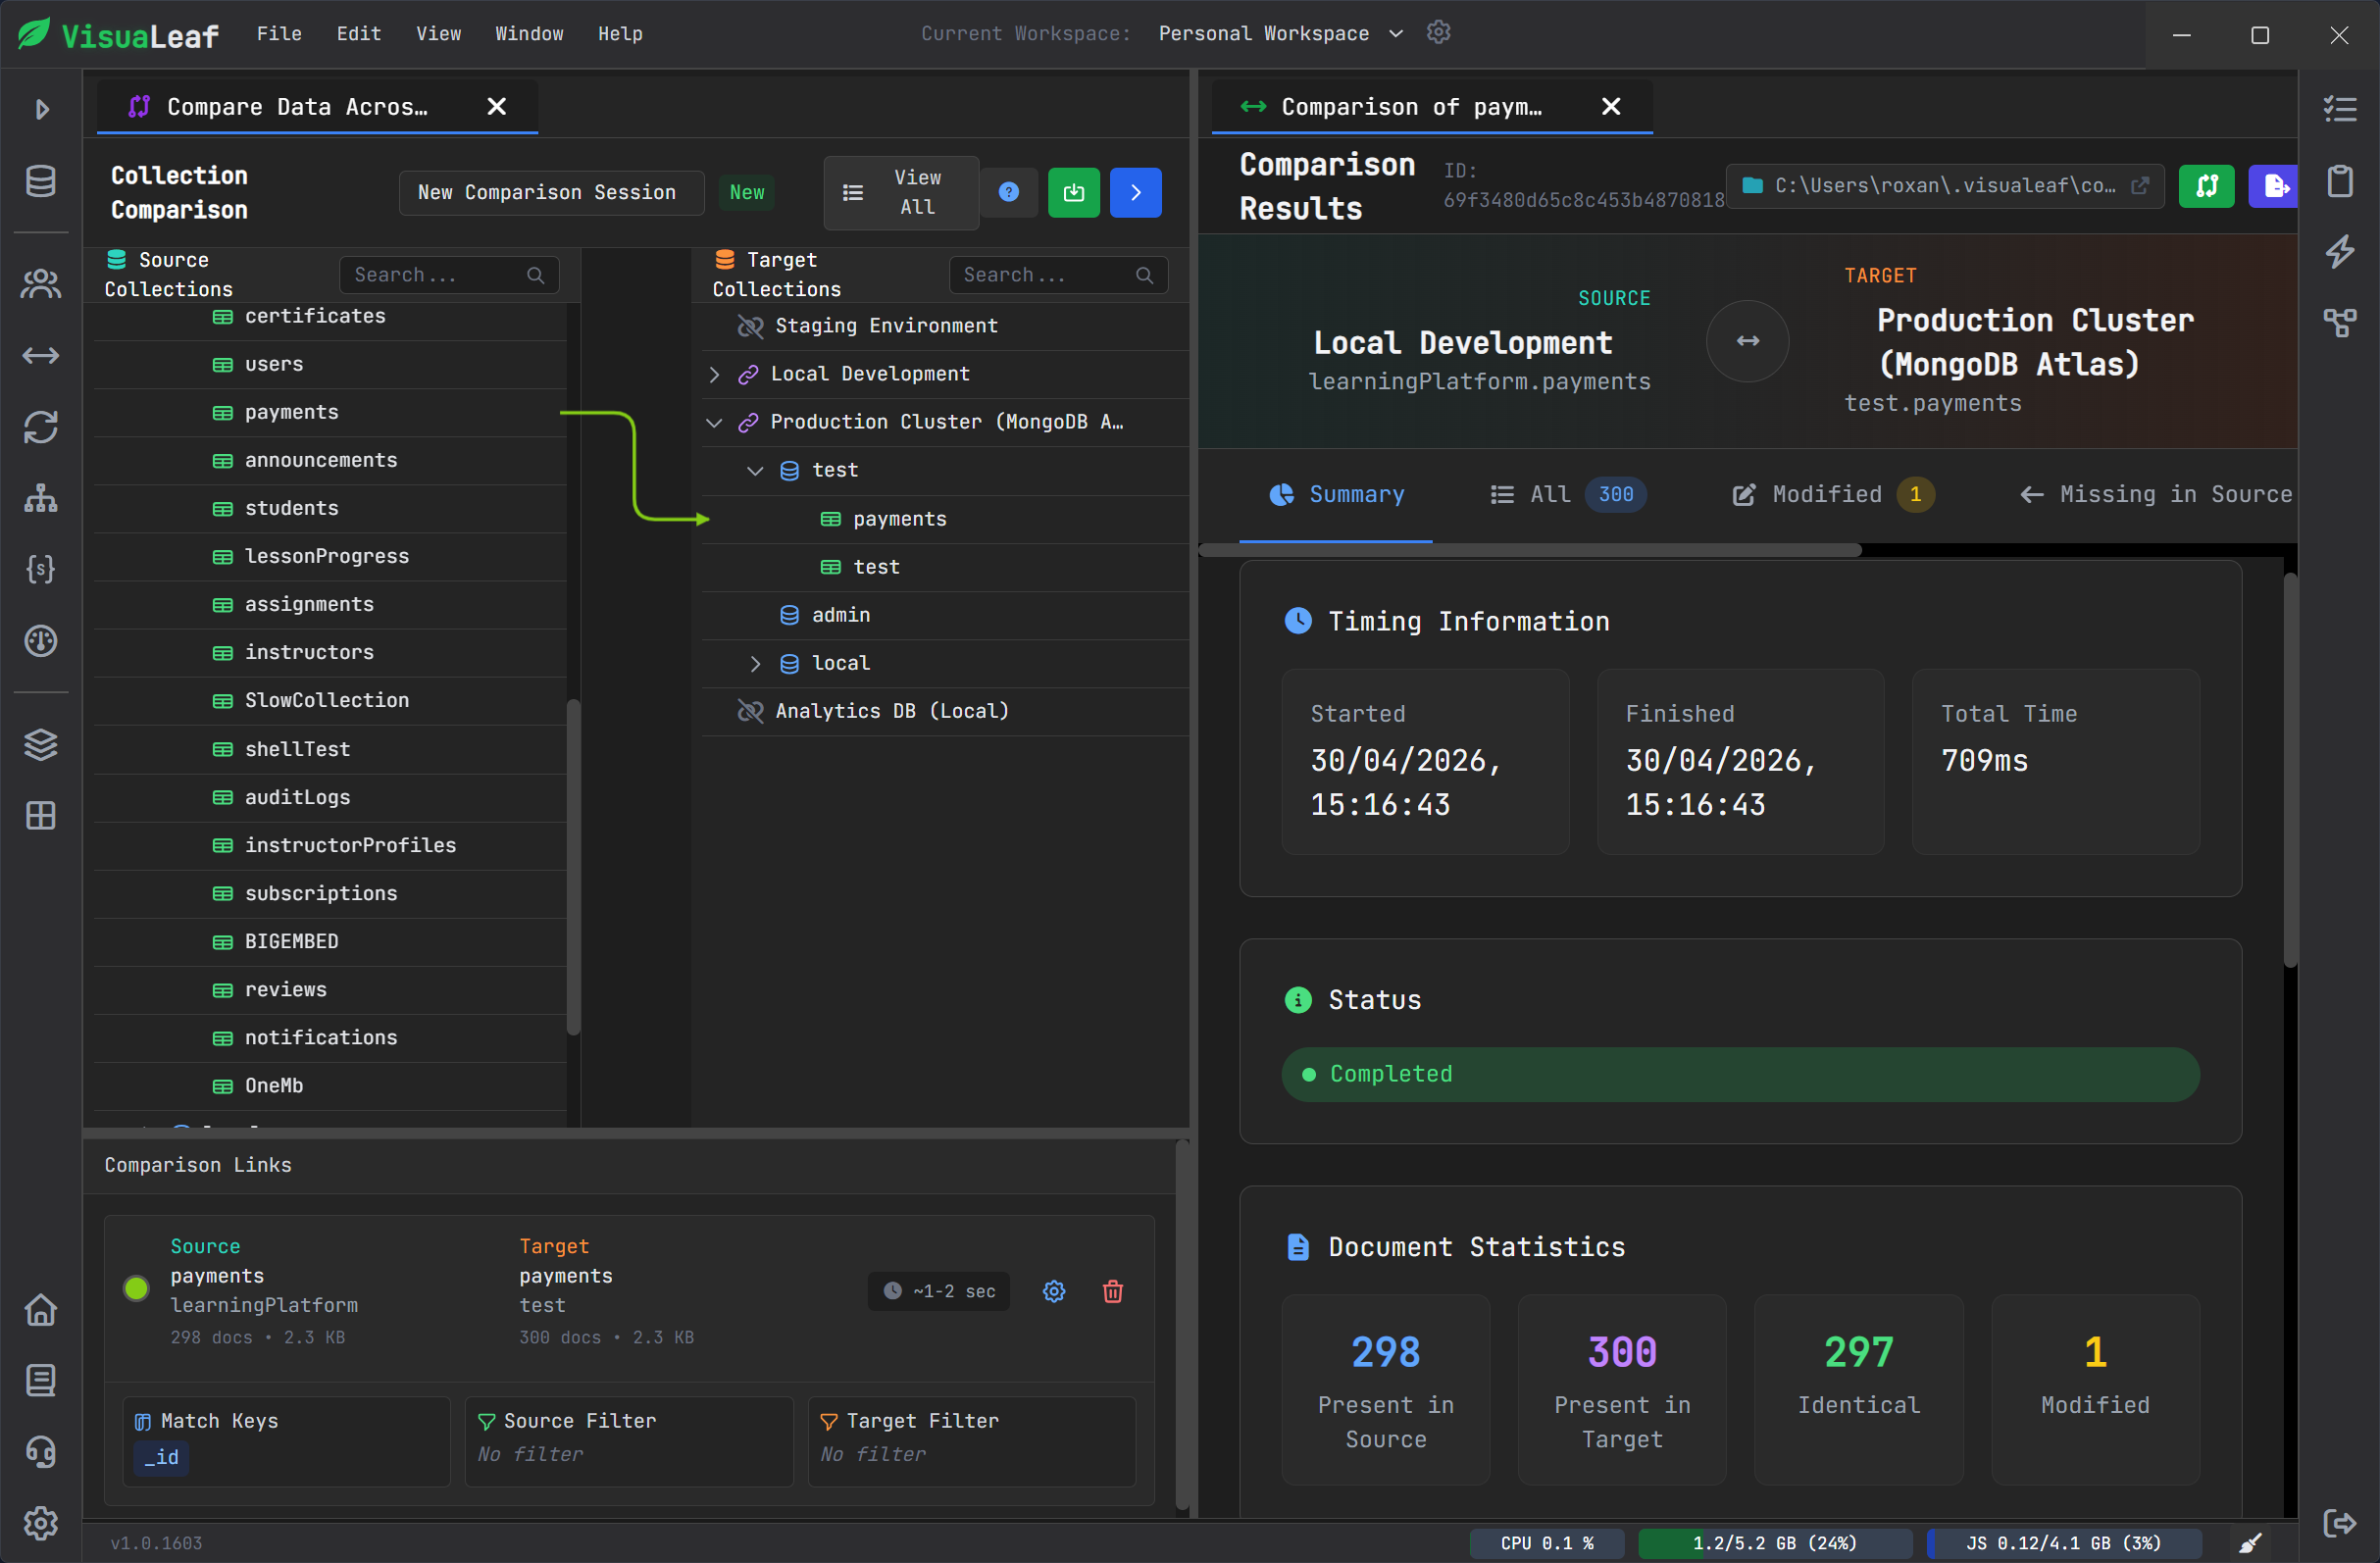
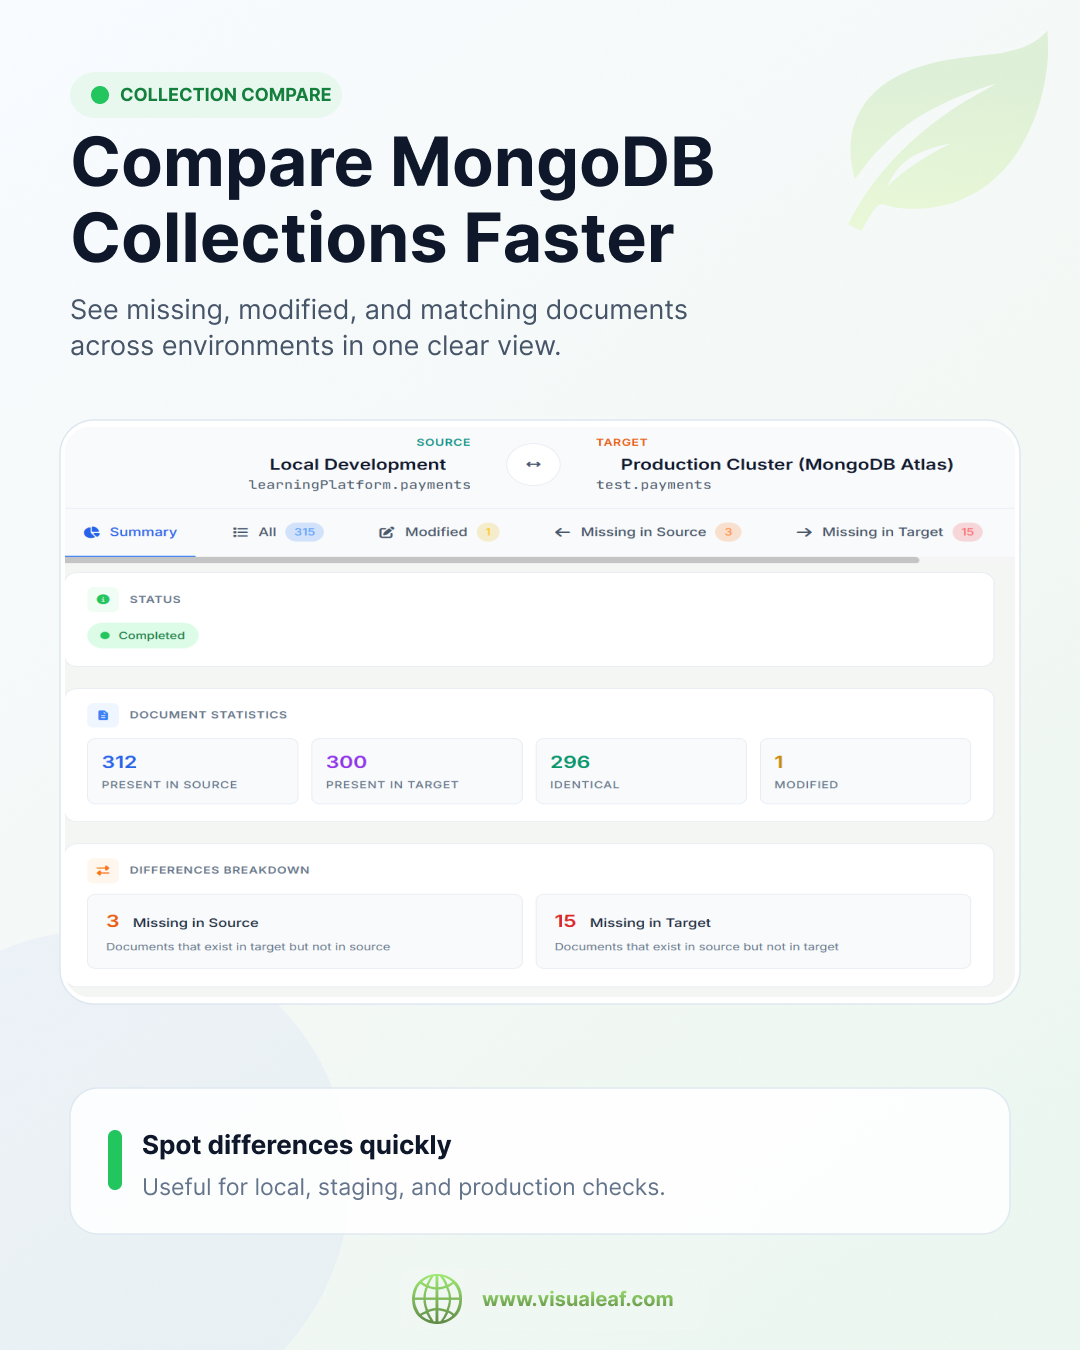
Compare collections across environments
Local, staging, and production data do not always match.
A document may be missing. A field may be different. A test collection may be outdated. And checking everything manually is slow.
VisuaLeaf’s Collection Compare helps you compare MongoDB collections and see the differences clearly.
You can inspect missing documents, modified documents, and differences between collections before deciding what to fix or sync.
This is useful for developers, QA work, migration checks, and teams working with multiple MongoDB environments.
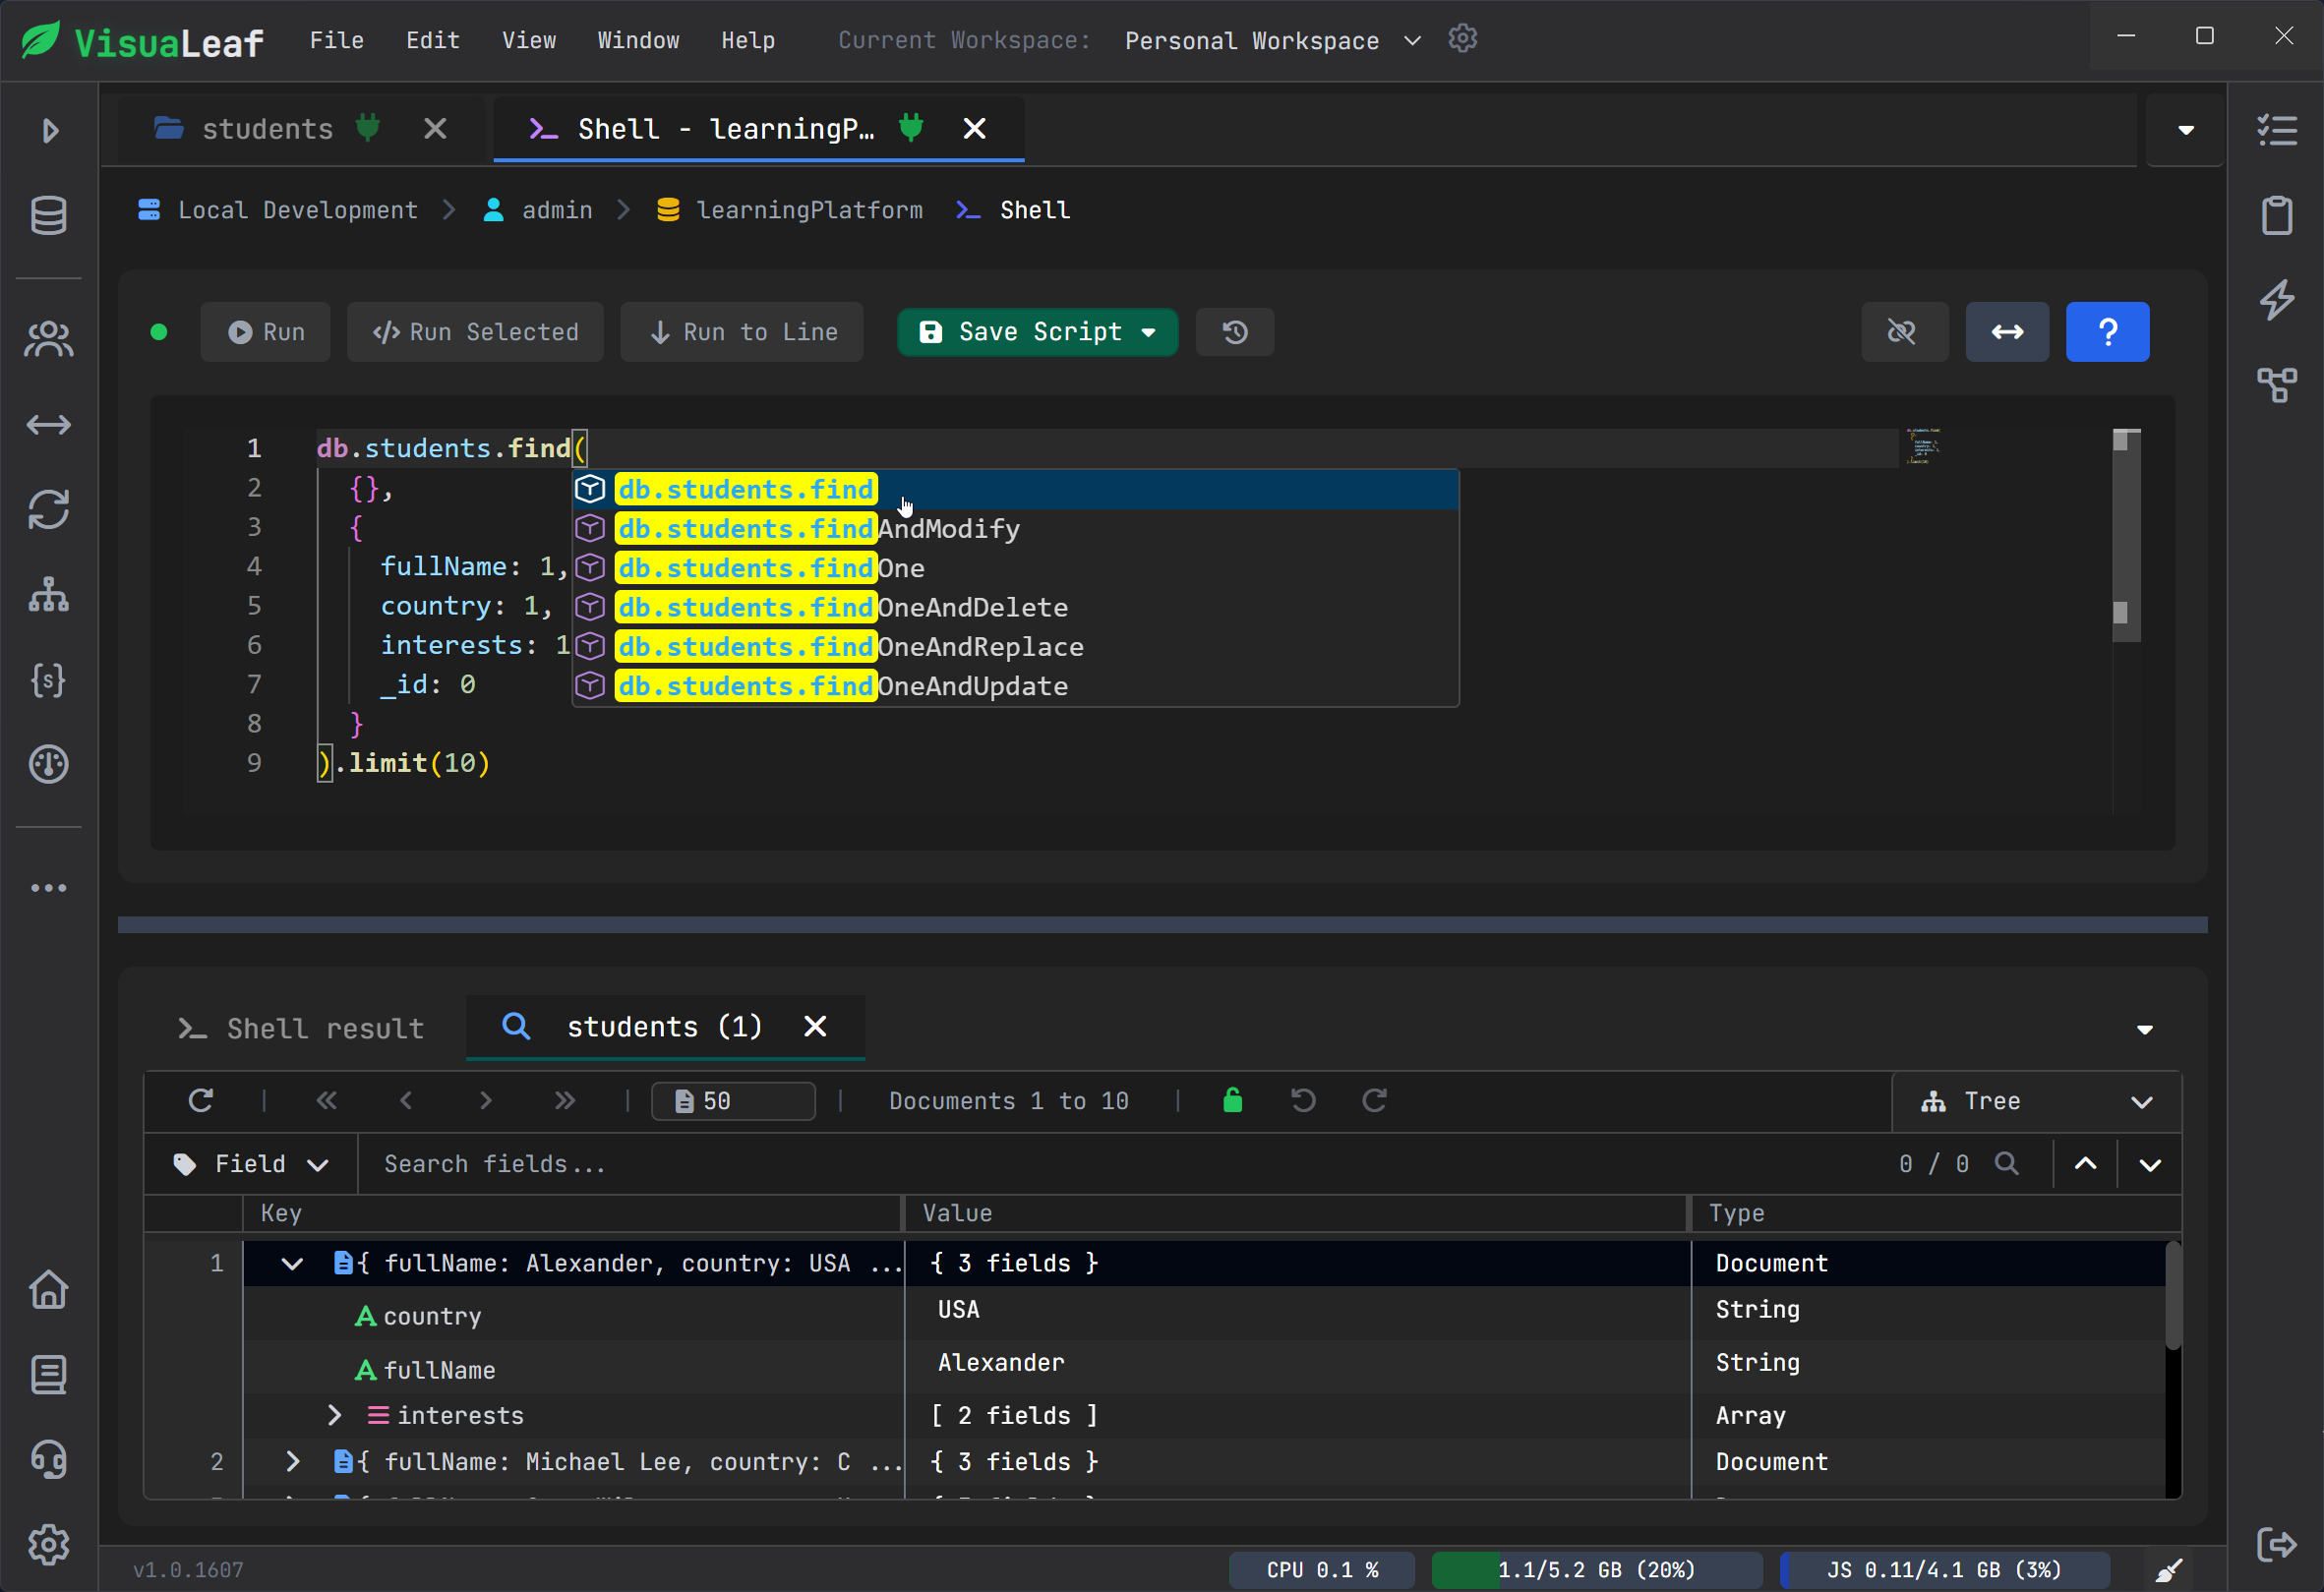
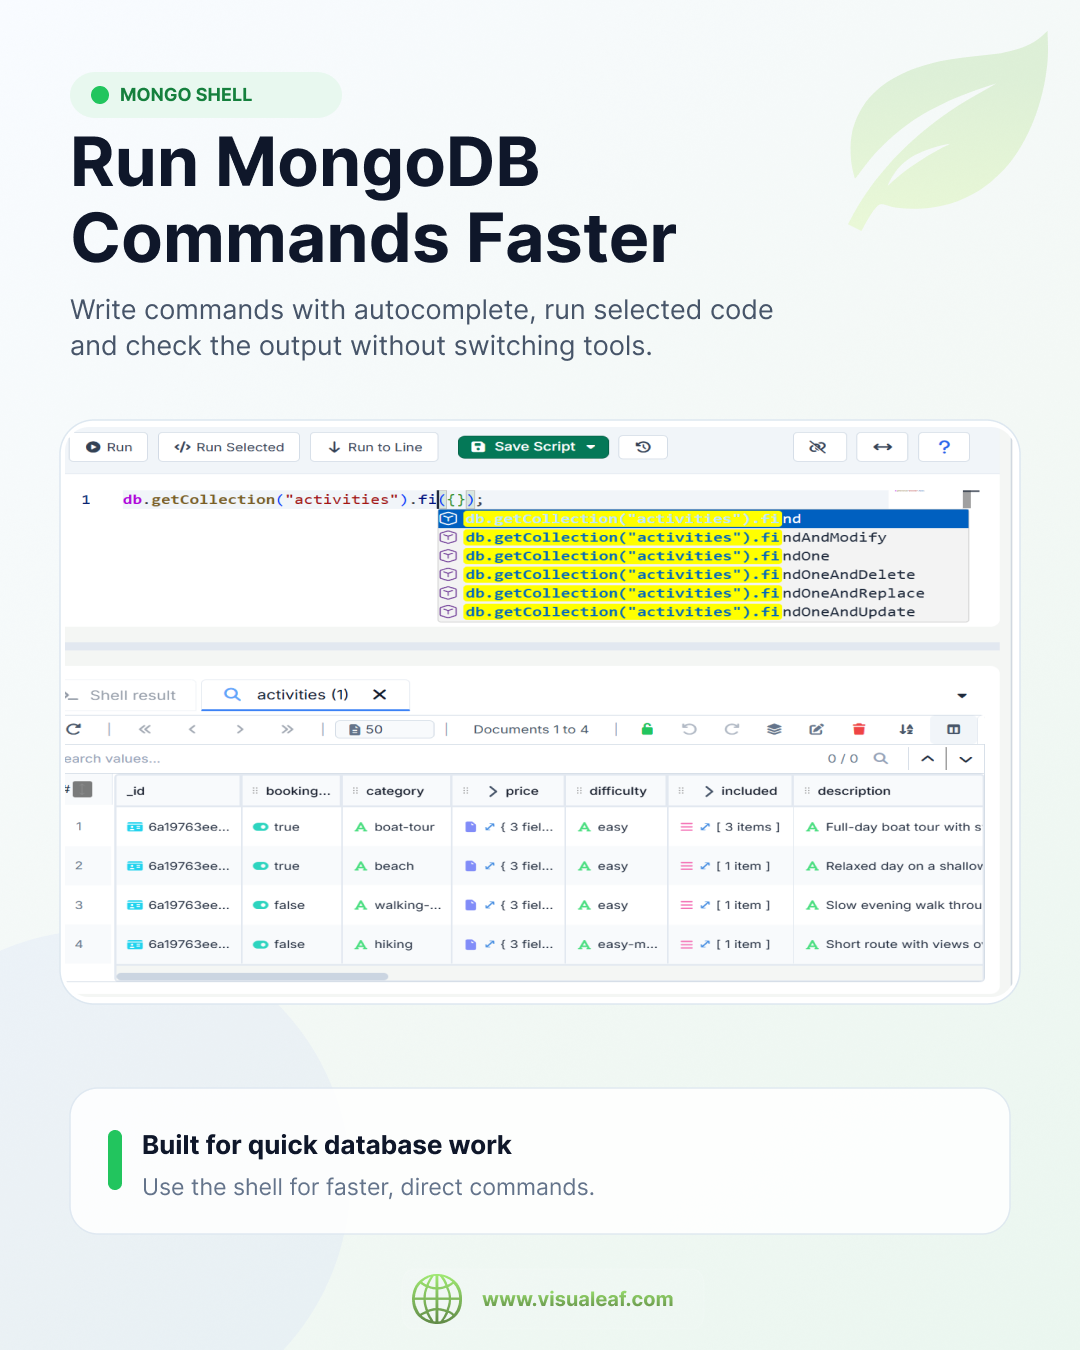
Use Mongo Shell when you need direct control
Visual tools are helpful, but sometimes the shell is still the fastest option.
VisuaLeaf includes a Mongo Shell with autocomplete, syntax highlighting, and visual results, so you can run commands directly inside the workspace.
This keeps the workflow flexible.
You can build visually when it saves time, or use the shell when a command gives you more direct control.
The result is still easy to read, because you are not just writing commands in a plain terminal. You can run MongoDB commands and inspect the output visually in the same place.
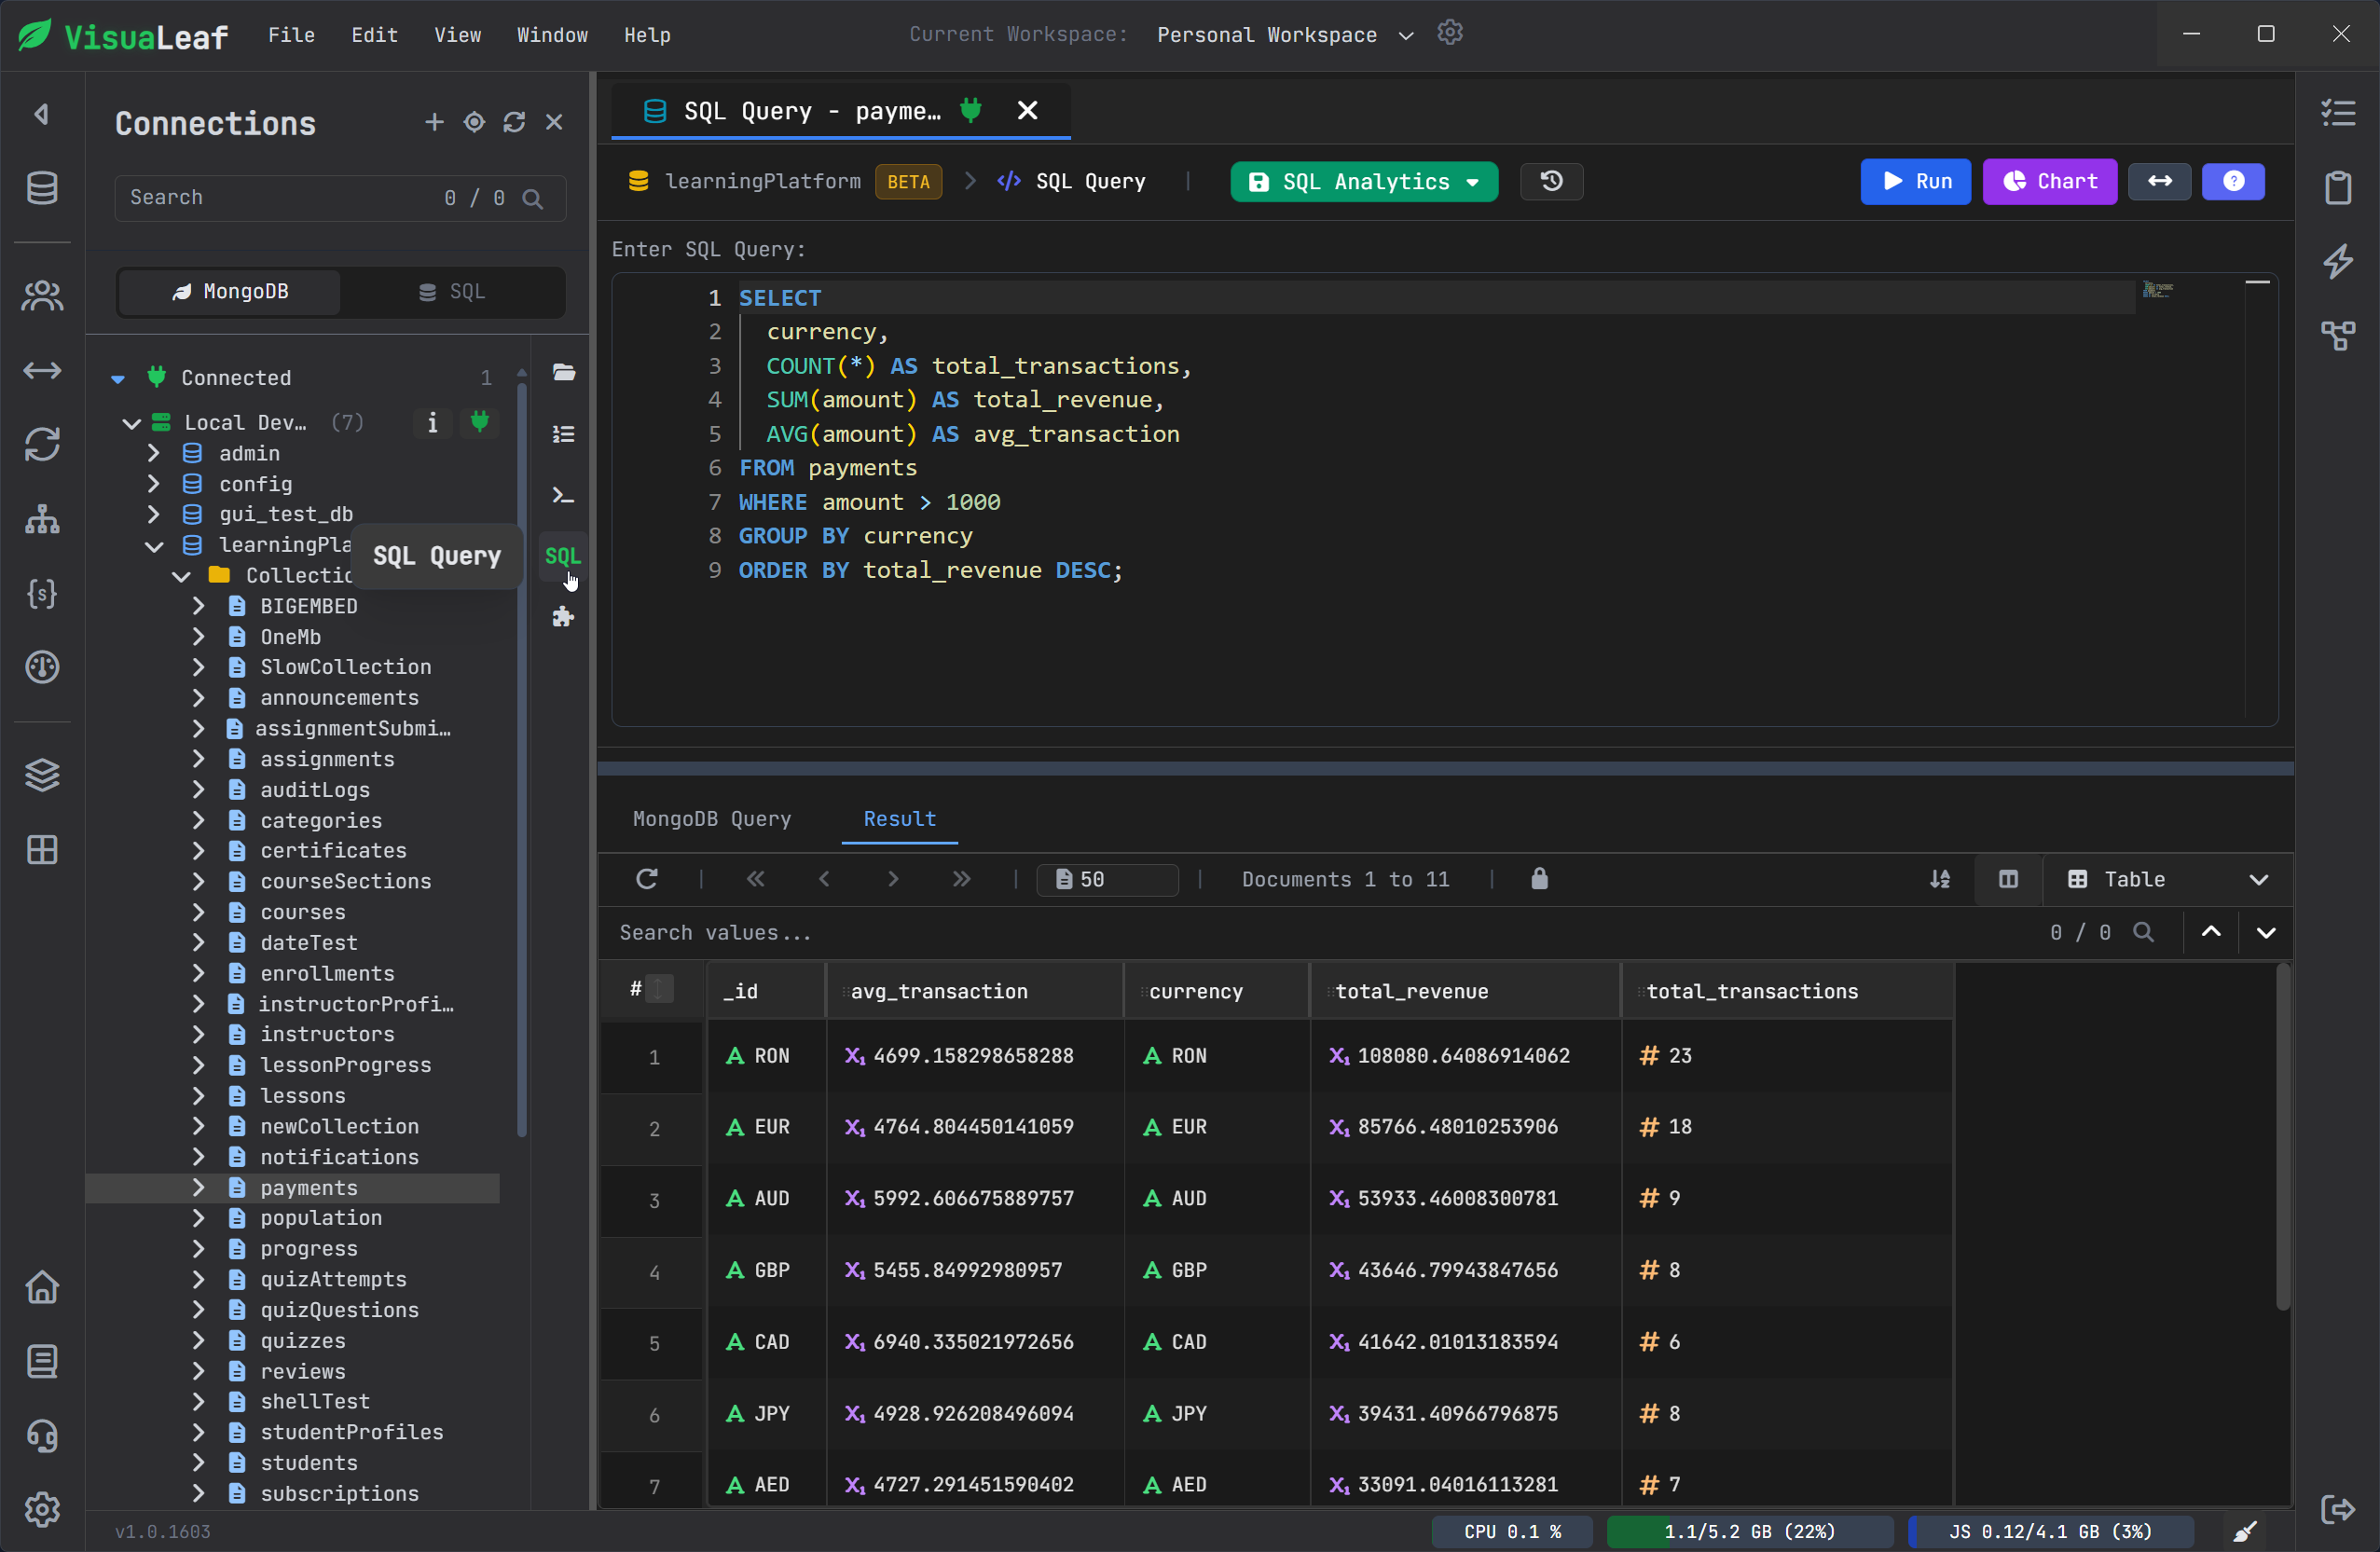
Query MongoDB with SQL Mode
Not every developer thinks in MongoDB syntax first.
Some teams also have developers who come from SQL databases, or people who simply find SQL easier for quick exploration.
VisuaLeaf includes SQL Mode, so you can work with MongoDB data using a SQL-style query workflow.
This can help when you want to explore collections faster, explain data to someone with a relational database background, or move between SQL and MongoDB work without changing tools.
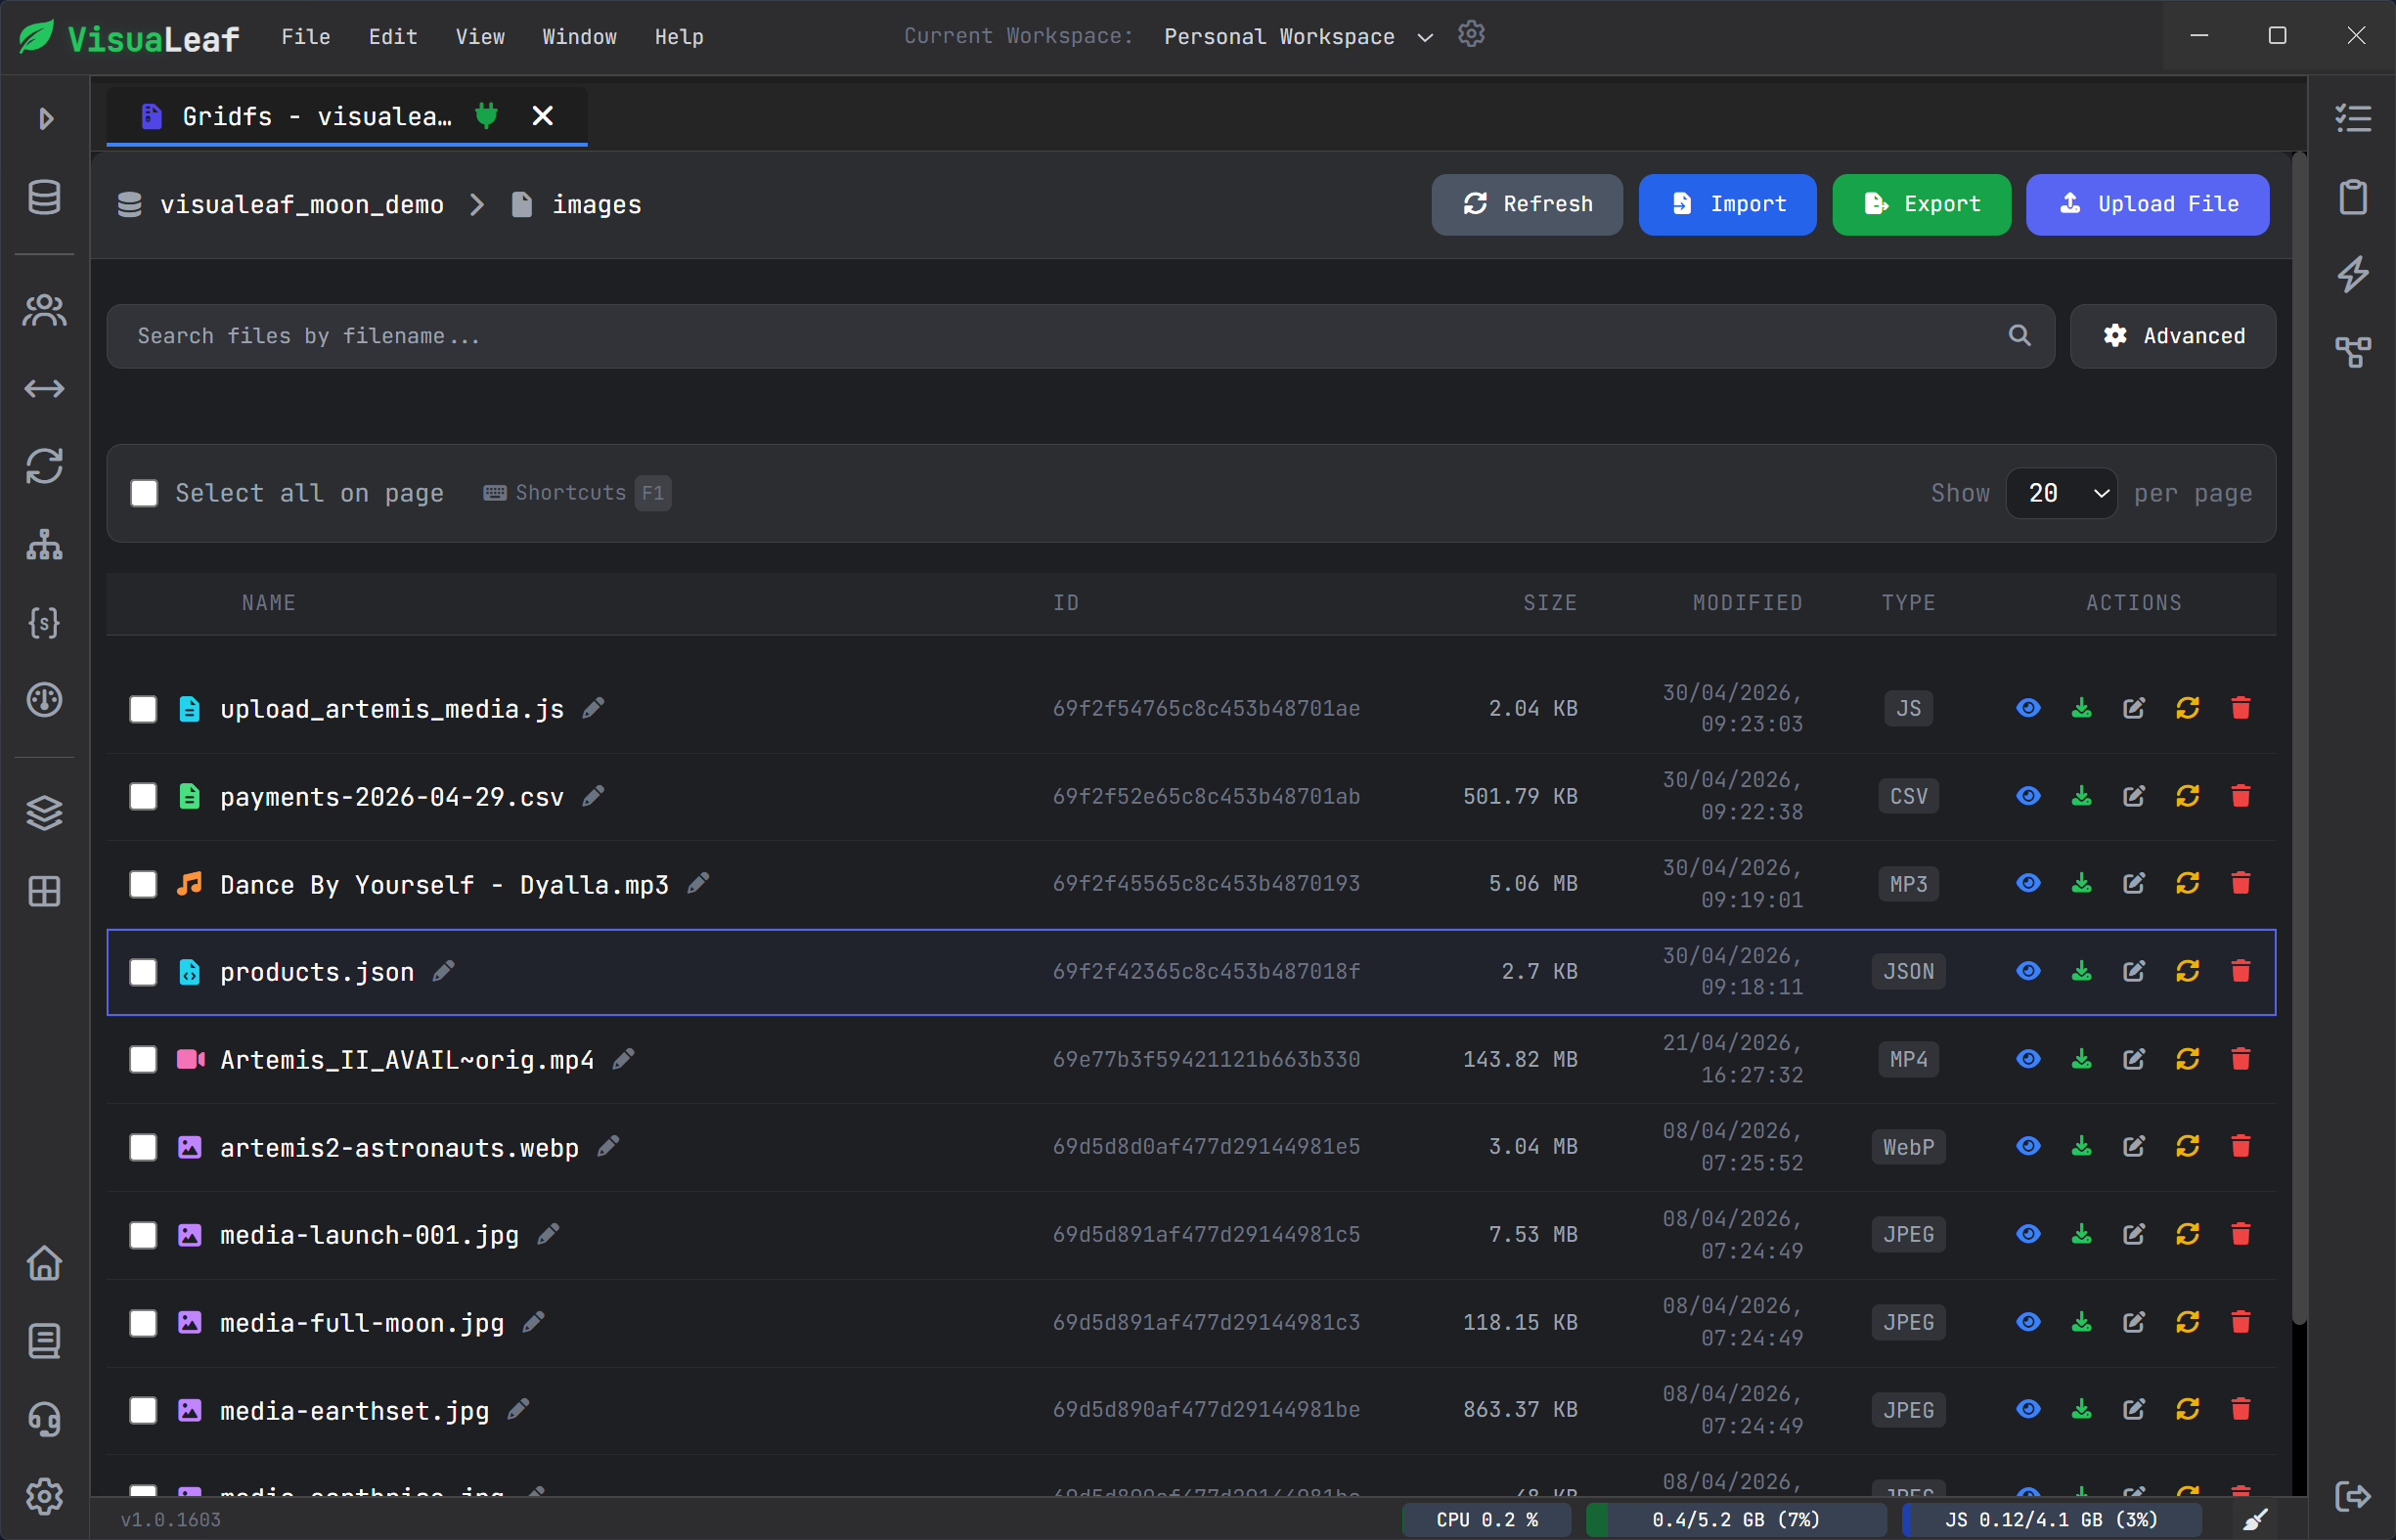
View files stored in GridFS
MongoDB is not always only documents.
Some projects also store files using GridFS.
VisuaLeaf includes a GridFS Viewer, so you can inspect files and file metadata from the same MongoDB workspace.
This is useful when your application stores images, documents, uploads, or other large files in MongoDB.
Instead of checking file data separately, you can keep it close to the collections and database structure you are already using.
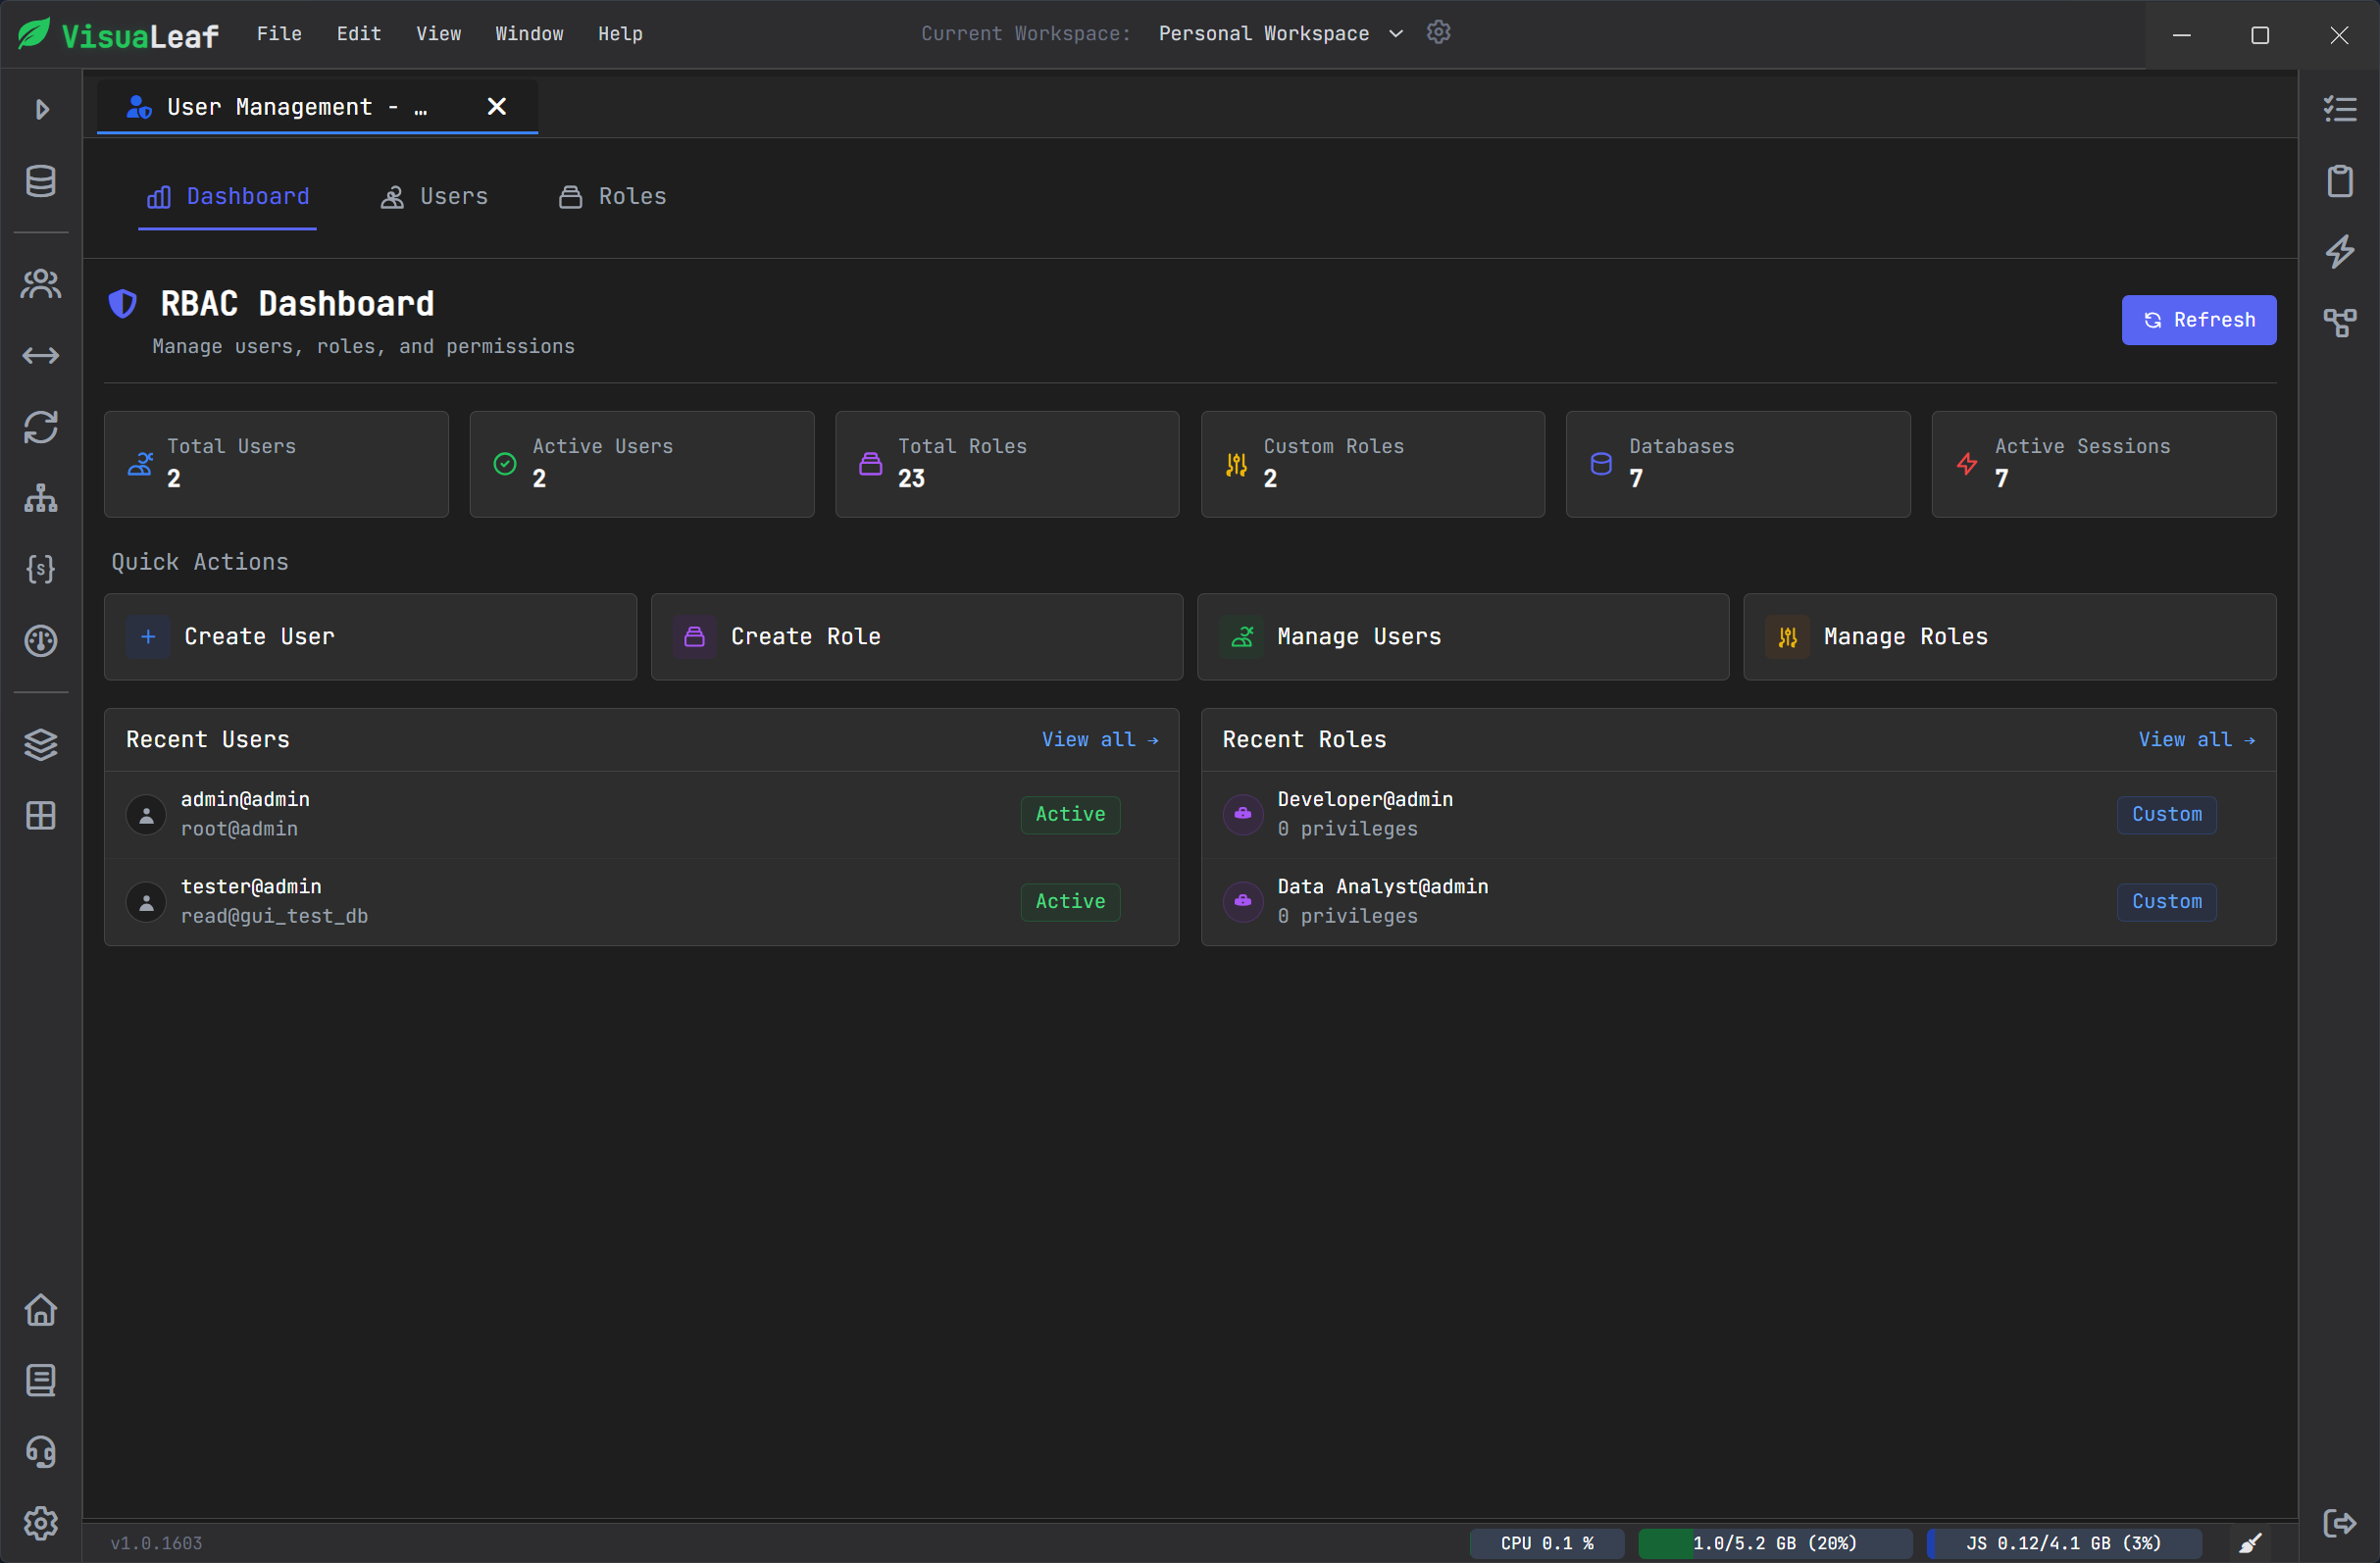
Review users and roles with RBAC Dashboard
For teams, MongoDB access is not only about connecting to the database.
You also need to understand who has access, which roles exist, and what permissions are assigned.
VisuaLeaf’s RBAC Dashboard helps you review MongoDB users, roles, and permissions in a clearer way.
This is useful for team databases, shared environments, and projects where access control needs to be checked without digging through everything manually.
Quick feature summary
Replace the long final list with this:
| VisuaLeaf feature | What it helps with |
|---|---|
| Connection Manager | Organize local, Atlas, staging, and production MongoDB connections. |
| Collection Browser | View MongoDB documents in Tree, Table, JSON, and BSON views. |
| Visual Query Builder | Build filters, sorting, projection, and limits visually. |
| Aggregation Pipeline Builder | Create and debug MongoDB pipelines stage by stage. |
| AI Assistant | Generate a first query or aggregation pipeline, then review and edit it. |
| Visual Schema | Understand collections, fields, embedded documents, and references. |
| Schema Validation | Enforce structure with MongoDB JSON Schema validation rules. |
| Charts & Dashboards | Turn MongoDB data into visual reports and dashboards. |
| Query Profiler | Check slow queries and understand performance problems. |
| Explain Viewer | See how MongoDB runs a query and whether indexes are used. |
| Task Manager | Organize and run repeated MongoDB workflows. |
| Collection Compare | Compare local, staging, production, or Atlas collections. |
| MongoDB Shell | Run commands with autocomplete, syntax highlighting, and visual results. |
| SQL Mode | Explore MongoDB data with a SQL-style workflow. |
| GridFS Viewer | View files and metadata stored in MongoDB GridFS. |
| RBAC Dashboard | Review MongoDB users, roles, and permissions. |
| Split Panel Views | Work with multiple views side by side. |
| Light Theme | Make demos, tutorials, screenshots, and team calls easier to follow. |
Work in a cleaner light theme
VisuaLeaf also includes a light theme.
This is useful when you create tutorials, record videos, take screenshots, share your screen, or expalain MongoDB work during a team call.
Dark mode is still great for focused work.
But light mode can make query builders, schema diagrams, charts, dashboards, and collection compare screens easier to present.
For a visual MongoDB workspace, that matters.
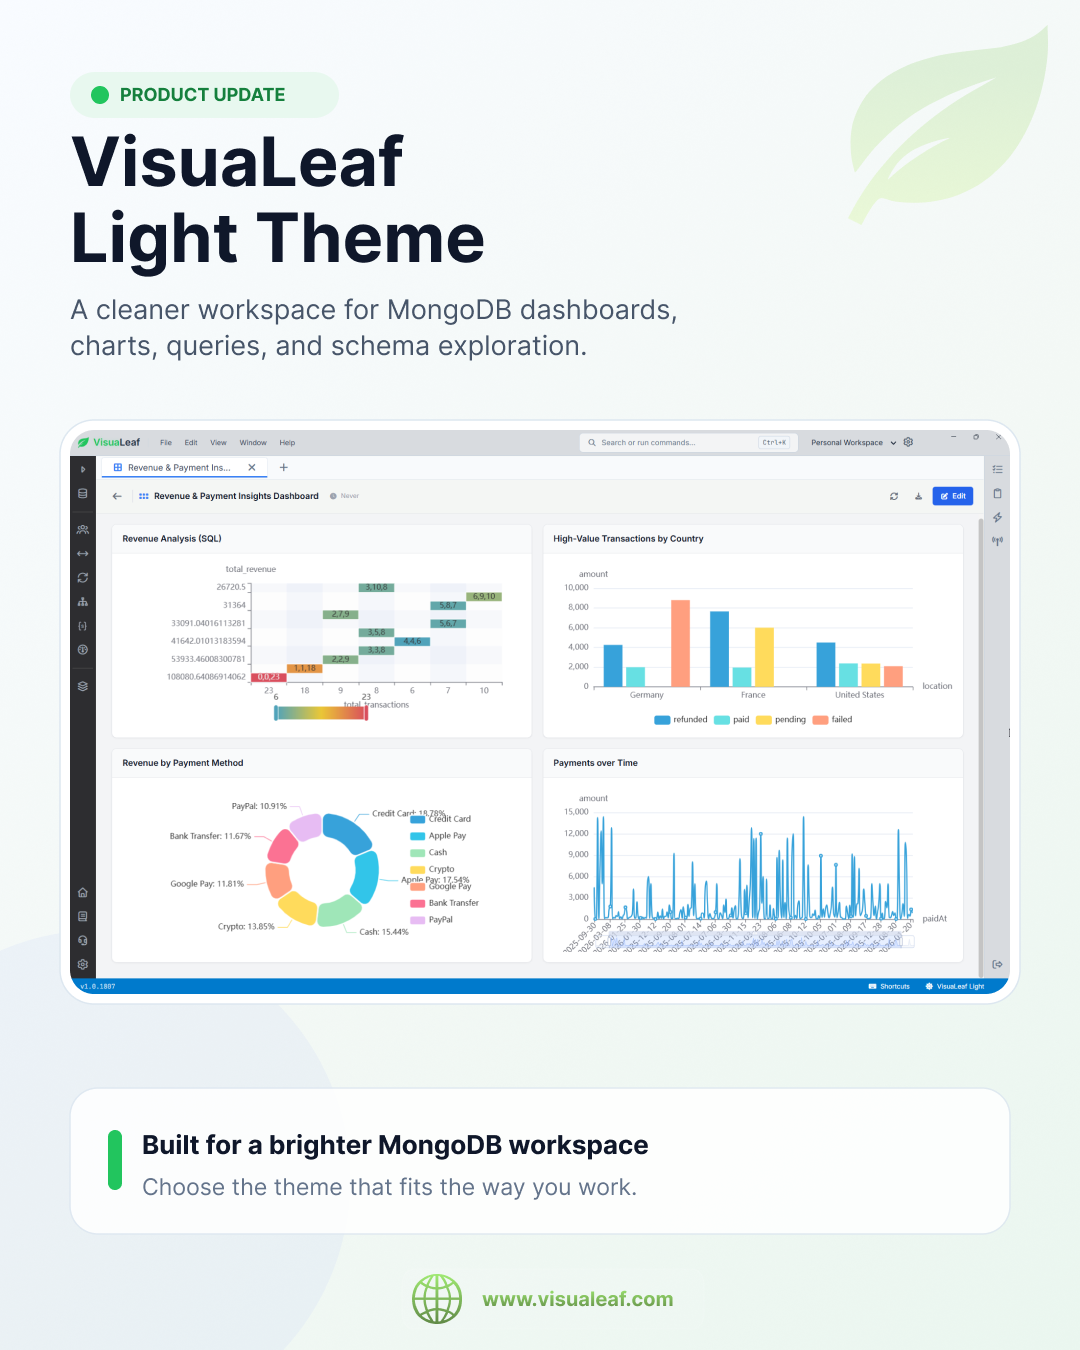
VisuaLeaf Light Theme
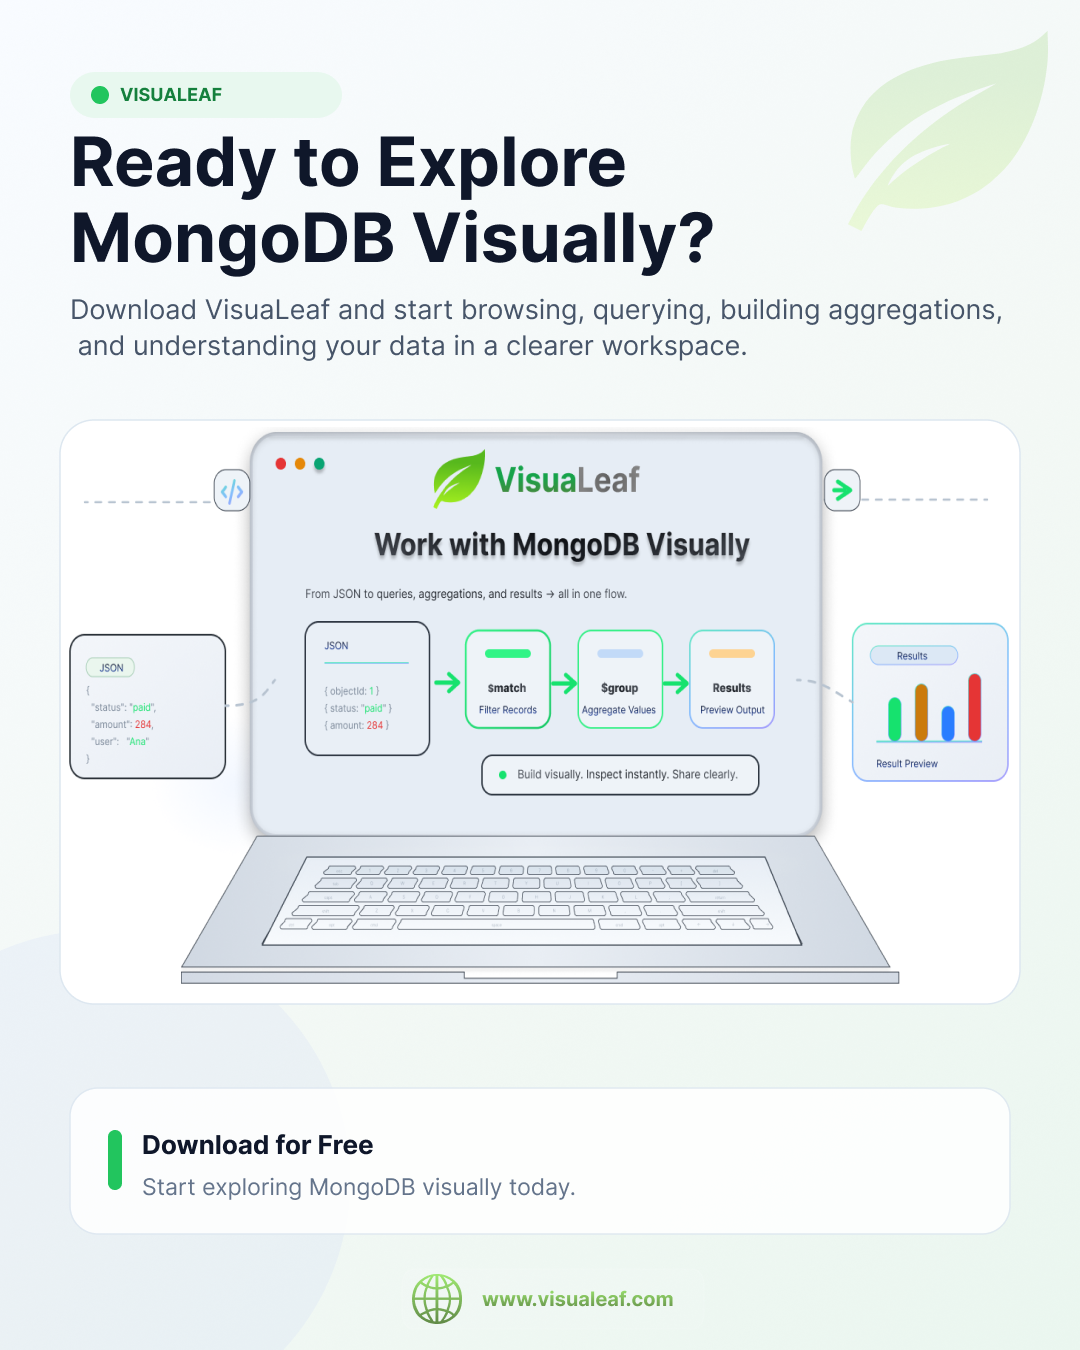
Try VisuaLeaf Free
Build MongoDB queries, aggregation pipelines, NoSQL schema diagrams, charts, dashboards, collection comparisons, tasks, and performance workflows in one visual workspace.
Download the Free Community Edition and start with a 14-day Pro trial.