Get Started Free

Follow the Rows From Table to Result

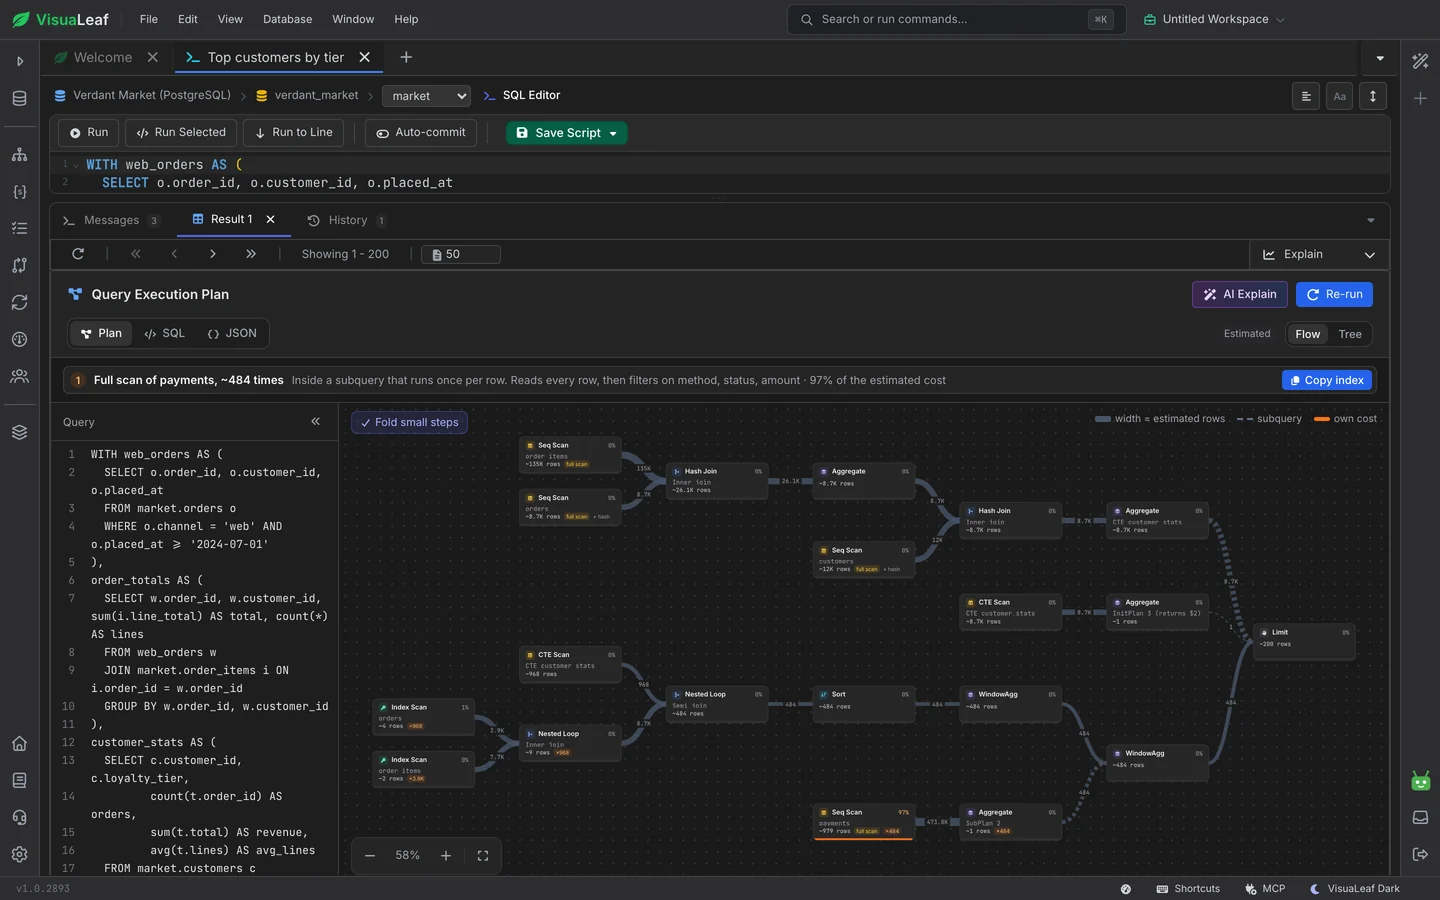
The plan reads left to right, from the tables to the result. The thicker a connection, the more rows pass through it. Each step shows its own cost, not the cost of everything underneath it, so only the step that does the work lights up and the steps above it stay quiet.

Explain flow for a SQL query, reading from the scanned tables on the left to the result on the right

The Slow Step, Named, With a Fix

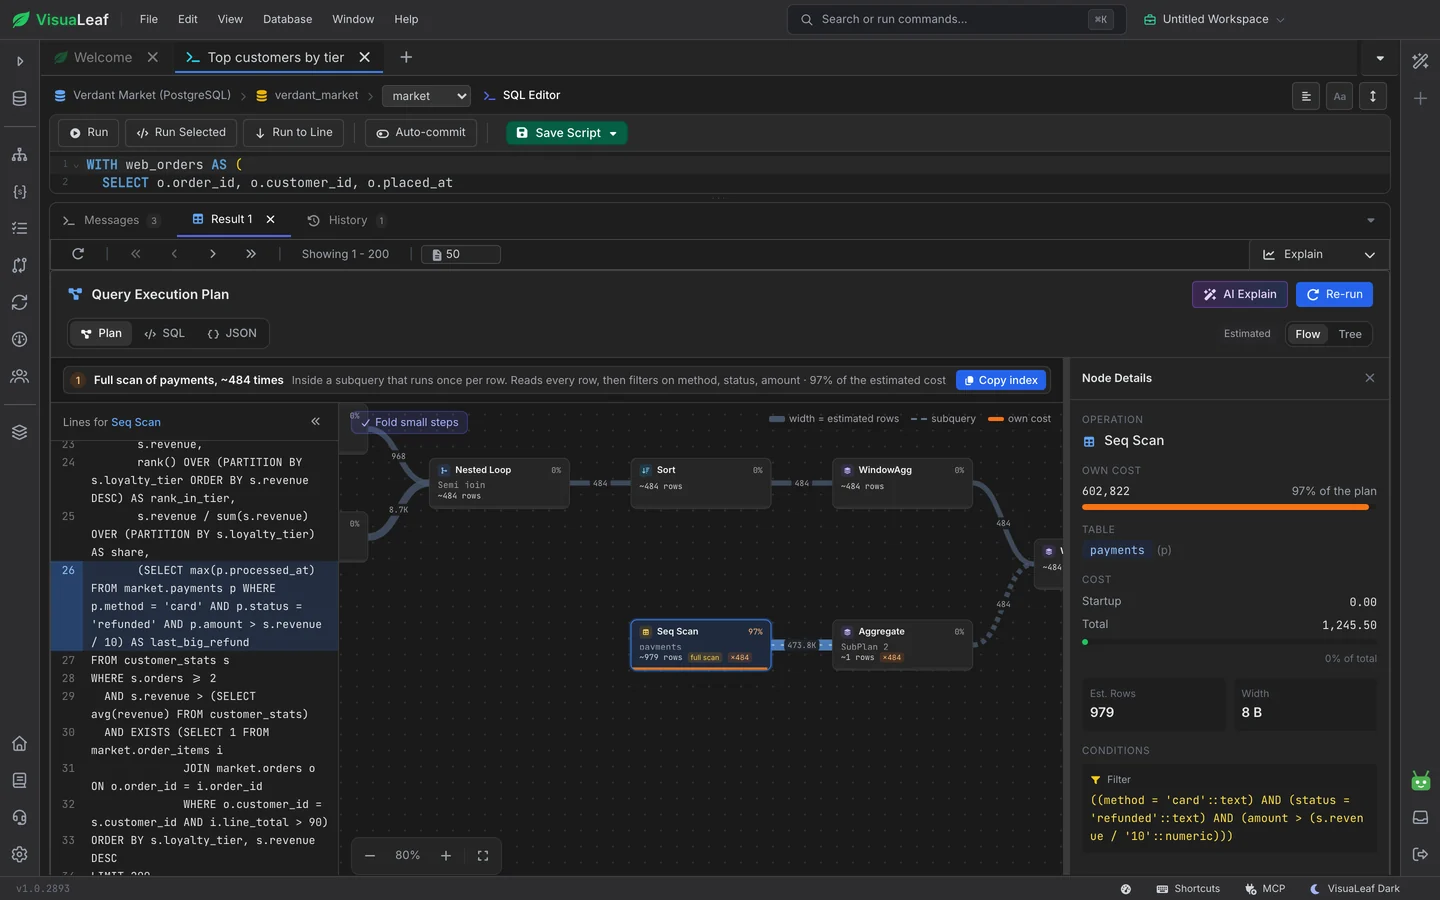
Above the plan, VisuaLeaf says in plain words what is slow and why: here, a full scan of payments inside a subquery that runs once for each of ~484 rows, 97% of the cost. Copy index puts a CREATE INDEX for it on your clipboard. Click any step to see the lines of your query it comes from, its condition and its numbers. Click a connection to select the two steps it joins.

The costly Seq Scan selected, with its lines of SQL highlighted on the left and its cost and filter in the details panel

A Tree When You Want the Shape

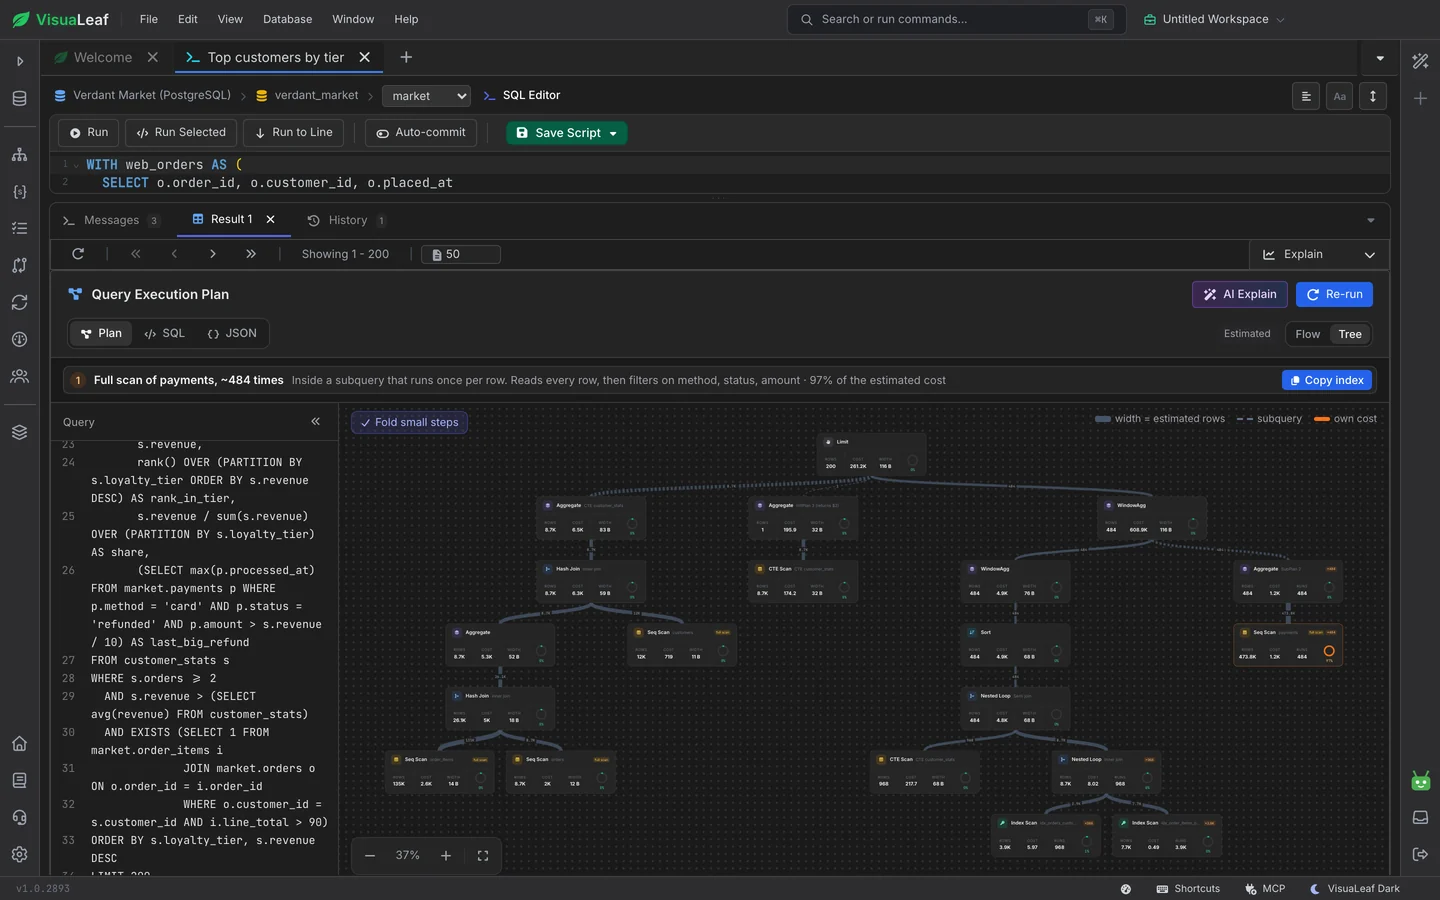
Switch to Tree to see the same plan top-down, with the result at the top and its inputs spreading out below. Each card shows rows, cost and how many times the step runs, with a ring for its share of the total. A long plan continues in a second column instead of shrinking into a thin strip.

The same SQL plan as a top-down tree, with the full scan of payments ringed in orange

MongoDB Aggregations, Across Every Shard

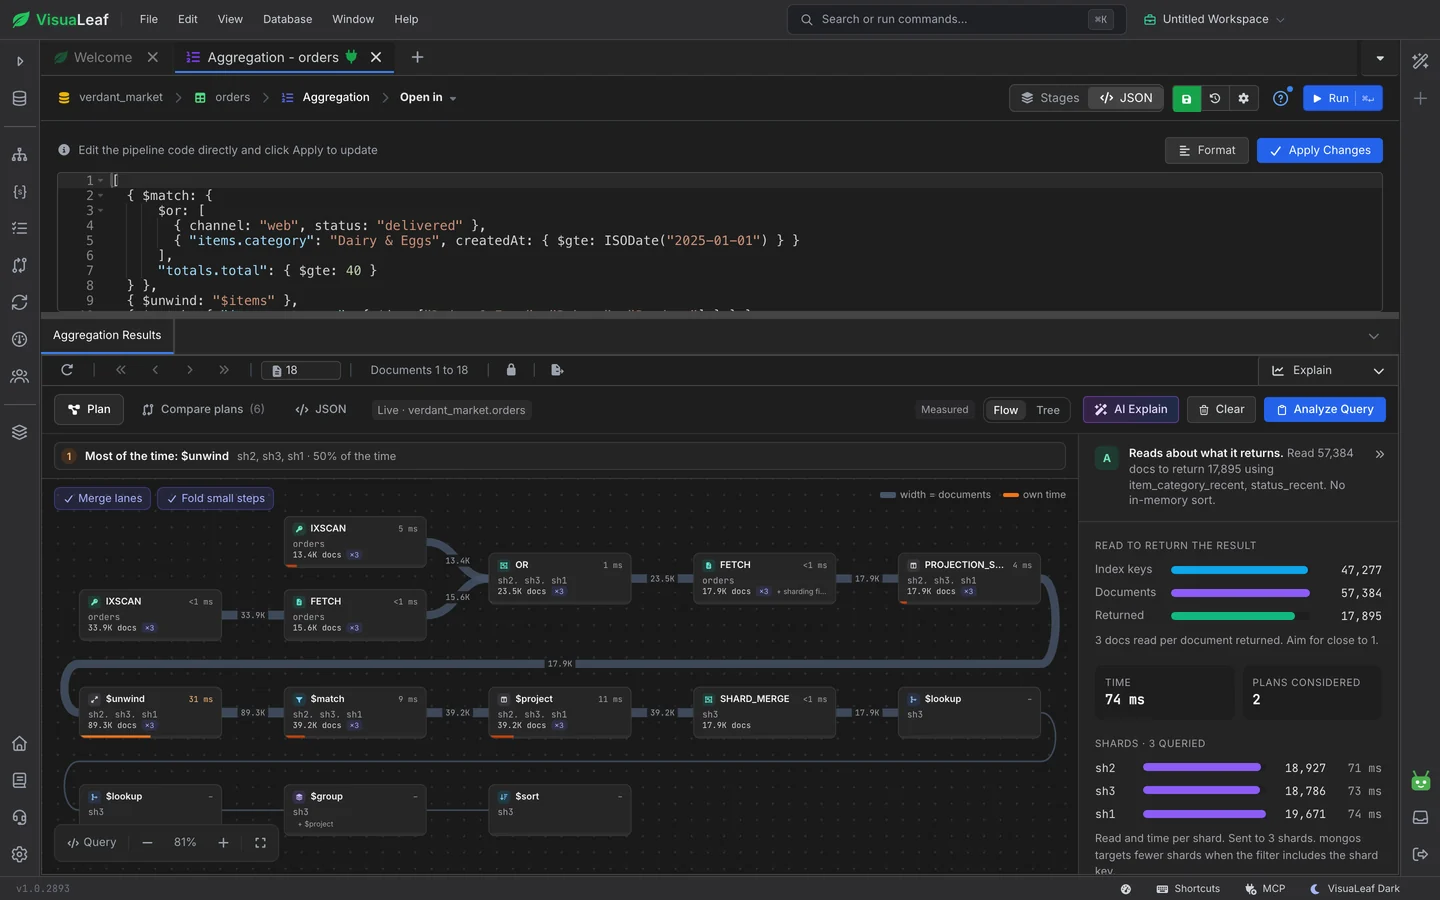
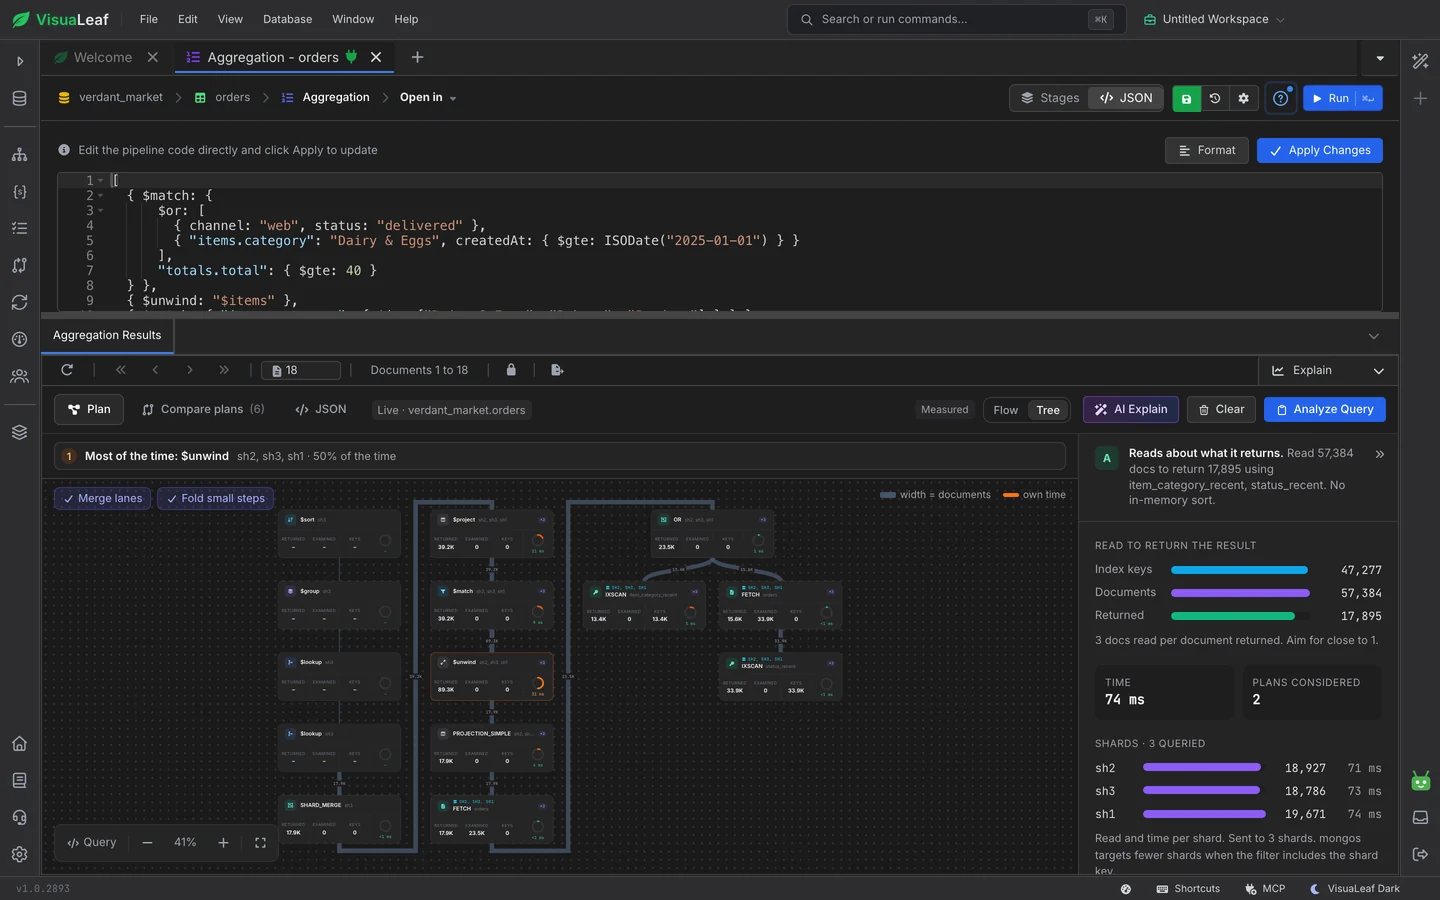
On MongoDB, the plan comes with measured times. Shards that ran the same steps merge into one lane marked ×3, with their counts added up, and the whole pipeline is there, including the stages that run after the shards are merged. The panel on the right compares keys read, documents read and documents returned, and shows what each shard read and how long it took.

Explain for an aggregation on a three-shard MongoDB cluster, with the shard lanes merged and the time per shard on the right

Fewer Boxes, Nothing Hidden

Small pass-through steps fold into their neighbours and repeated shard lanes merge, so a 39-step sharded plan fits on one screen. Turn off Merge lanes or Fold small steps to see every step on every shard. The tree shows Returned, Examined and Keys for each stage, and a dash where MongoDB reports no number.

MongoDB aggregation plan as a tree with Returned, Examined and Keys on each stage
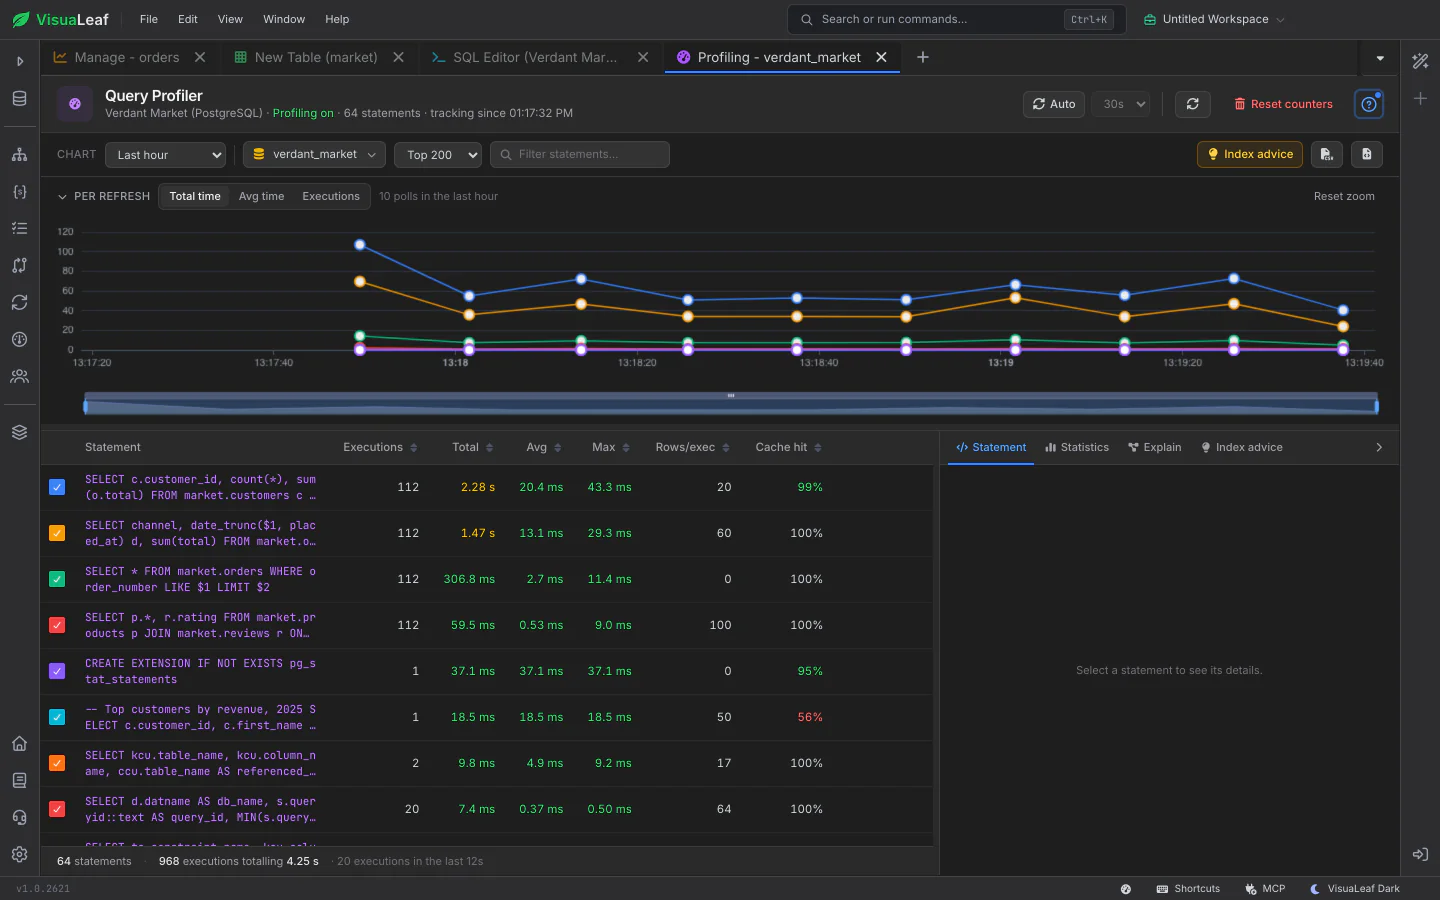
VisuaLeaf SQL Query Profiler with the most expensive statements

Query Profiler

Find which statements cost your server the most over time, then open one to read its plan here.

VisuaLeaf Index Manager

Index Manager

Create the index Explain suggested, see how often each index is used and drop the ones nothing reads.

Want to Learn More?

Check out the documentation to read more about Explain and discover more VisuaLeaf features.

Read the Documentation

Ready to find your slow step?

Get started free with our Community Edition. Includes a 14-day trial of Pro features.

macOS Windows Linux