Conway's Game of Life Just Using Mongo Shell
A Quick Fun Article on How You Can Create Conway's Game of Life Using Just the MongoDB Shell and Nothing Else!


It really surprises me the number of people who don't know how the mongo shell works. Most of the people I see seem to think it's just db.find()s or db.aggregate()s with some print statements, and that's it. The mongo shell is interesting because it's fundamentally different from your regular SQL editor, where you can't declare a variable or write a loop. But the mongo shell is so much more than just MongoDB functions. It's a full JavaScript runtime built on Node.js, with variables, functions, closures, classes, and so much more. Your database is just an object sitting inside it.
In this article, I want to show the perspective of not just using the MongoDB functions in the mongo shell, but actually using the full potential of the shell, with examples like Conway's Game of Life and some custom chart diagrams.
Now first, the mongo shell was designed with JS in mind (prints, for loops, if statements, all of that), so using its full potential to manage your MongoDB database is crucial. If you wanted to migrate data, or if you wanted to create a script that edits certain types of data with conditions, you can do all of that with the mongo shell. I've been seeing a LOT of people trying to make their own shell with just db.find(), db.aggregate(), and print, but that's not a shell… it's literally just an empty shell of what the mongo shell actually is (pun intended).
Charts in your console, no library needed
Now, let's get on with something fun the mongo shell can do before we talk about Conway's Game of Life. The shell can print stuff to the console, so you can actually make a lot of cool visualizations right in your mongo shell. Here I made a shell script that literally visualizes data, so you don't need a charting library to see what's in your database. It's simple, but it's fun and it does the job:
function bar(coll, field) {
  const rows = db.getCollection(coll).aggregate([
    { $group: { _id: "$" + field, count: { $sum: 1 } } },
    { $sort:  { count: -1 } }
  ]).toArray();
  const max = Math.max(...rows.map(r => r.count));
  rows.forEach(r => {
    const len = Math.round(r.count / max * 40);
    print(String(r._id).padEnd(12) + " │" + "█".repeat(len) + " " + r.count);
  });
}

bar("orders", "status");
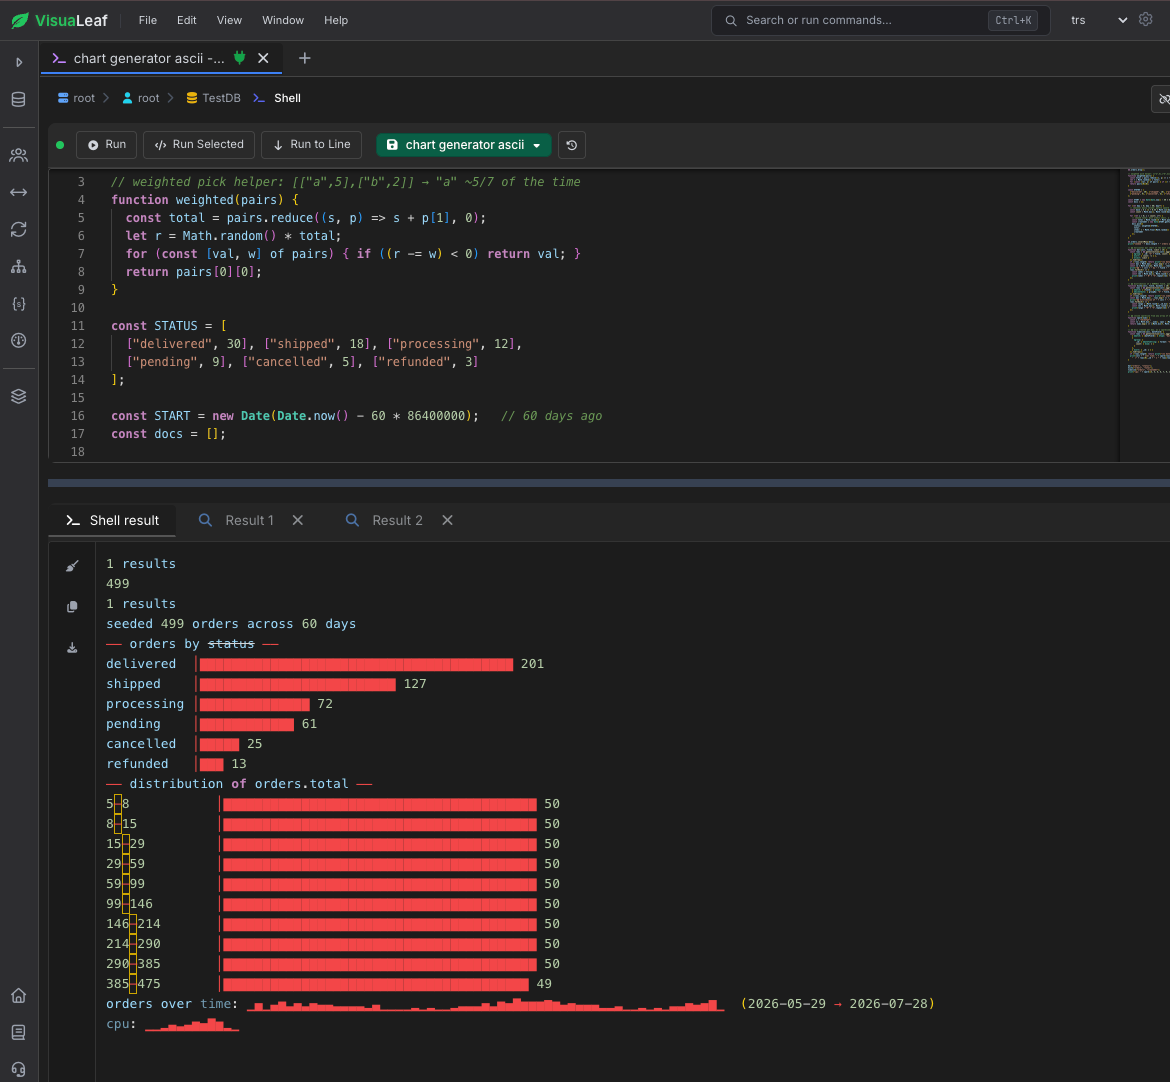
As you can see, with this simple script we were able to visualize bar charts just like that. And notice what's actually happening here: this is the shell being a language, not a command line. The aggregate() call is normal MongoDB. $group counts how many documents share each value of the field, and $sort puts the biggest first. But everything after that is plain JavaScript. We store the results in a variable, use Math.max to find the largest count, then loop over the rows and print() a bar for each one, scaled to 40 characters wide with "█".repeat(). A variable, a spread, a loop, string methods. None of that exists in a SQL prompt. Here it's just Tuesday.
Okay, now Conway's Game of Life
Now, by utilizing prints the same way we did for the chart generation, we can actually simulate the famous Conway's Game of Life JUST using mongosh, which is crazy. I'm not going to delve too much into Conway's Game of Life itself, so here are the quick rules.
It's a grid of cells that are either alive or dead, and every generation, each cell counts its 8 neighbors:
- A live cell with 2 or 3 live neighbors survives.
- A live cell with fewer than 2 neighbors dies (loneliness).
- A live cell with more than 3 neighbors dies (overcrowding).
- A dead cell with exactly 3 live neighbors comes to life.
That's it. Four rules, and out of them you get gliders flying across the grid, oscillators pulsing forever, and guns that shoot out an endless stream of spaceships.
So how are we going to do that in MongoDB?
We can use prints to draw the state of the board in the console, and then apply the Game of Life rules with aggregations. Notice that the whole game is really just one operation: count each cell's neighbors, then apply a rule. That sentence basically describes an aggregation pipeline word for word. Count things per group, then filter. MongoDB can do the actual thinking; JavaScript just draws.
The trick is we don't store the grid as a big 2D array. We only store the living cells, one document each:
{ x: 12, y: 5 } // there's a live cell at column 12, row 5
If a document exists, the cell is alive. If it doesn't, it's dead. The whole universe is one collection called life. (This is actually a real modeling pattern, by the way, called sparse representation. Most of the grid is empty, so we only store what's "on" instead of millions of falses.)
Let's seed it with a Gosper glider gun, a famous pattern that fires a new glider every 30 generations, forever:
db.life.drop();

const GUN = [
  [0,4],[0,5],[1,4],[1,5],
  [10,4],[10,5],[10,6],[11,3],[11,7],[12,2],[12,8],[13,2],[13,8],
  [14,5],[15,3],[15,7],[16,4],[16,5],[16,6],[17,5],
  [20,2],[20,3],[20,4],[21,2],[21,3],[21,4],[22,1],[22,5],
  [24,0],[24,1],[24,5],[24,6],[34,2],[34,3],[35,2],[35,3]
];

db.life.insertMany(GUN.map(([x, y]) => ({ x, y })));
Here is the script for it
One generation = one aggregation. Every birth and every death for the entire board gets computed in a single pipeline:
function step() {
  const next = db.life.aggregate([
    // 1. Each cell emits itself + its 8 neighbors
    { $project: { cells: { $concatArrays: [
        [ { x: "$x", y: "$y", self: 1, n: 0 } ],
        { $map: {
            input: [[-1,-1],[-1,0],[-1,1],[0,-1],[0,1],[1,-1],[1,0],[1,1]],
            as: "d",
            in: { x: { $add: ["$x", { $arrayElemAt: ["$$d", 0] }] },
                  y: { $add: ["$y", { $arrayElemAt: ["$$d", 1] }] },
                  self: 0, n: 1 } } }
    ] } } },

    // 2. Flatten every emitted cell into its own document
    { $unwind: "$cells" },

    // 3. Tally, per coordinate: how many neighbors, and was it alive?
    { $group: {
        _id:  { x: "$cells.x", y: "$cells.y" },
        n:    { $sum: "$cells.n" },
        self: { $max: "$cells.self" } } },

    // 4. Conway's rule, pure MongoDB, no JavaScript
    { $match: { $expr: { $or: [
        { $eq: ["$n", 3] },                                       // birth
        { $and: [ { $eq: ["$self", 1] }, { $eq: ["$n", 2] } ] }   // survival
    ] } } },

    // 5. Shape the survivors back into clean {x, y} documents
    { $project: { _id: 0, x: "$_id.x", y: "$_id.y" } }
  ]).toArray();

  db.life.deleteMany({});
  if (next.length) db.life.insertMany(next);
}
Quick walkthrough of what each stage is doing, because every one of these is something you'll use in real queries:
$project+$map+$concatArrays(scatter). Each living cell builds an array: itself (markedself: 1), plus its 8 neighbors, generated by$map-ing over the offset pairs and$add-ing them to the cell's coordinates. Each neighbor is markedn: 1, meaning "one neighbor vote for this coordinate." Instead of each cell asking its neighbors who's alive, each cell tells its neighbors "you've got one more live neighbor."$unwind(explode). Flattens that array so every emitted cell becomes its own document. One live cell in, nine documents out.$group(gather). Group by coordinate:$sumthe votes to get the live neighbor count,$maxtheselfflag to know if that coordinate was actually alive. This one stage counts the neighbors for the entire board at once.$matchwith$expr(judge). Conway's rules, written entirely in MongoDB operators: exactly 3 neighbors (birth), or alive with exactly 2 (survival). Everything else just doesn't match and quietly dies. Noifstatements. The database evaluates the rule.$project(tidy up). Reshape the survivors back into plain{x, y}documents.
Then two lines of JavaScript swap the old generation for the new one. That's the only imperative code in the whole engine, and it's just bookkeeping.
Now for the drawing part, which is where the prints from the chart section come back. This is normal JavaScript, and the only MongoDB thing in it is the find():
function render(w, h) {
  const on = new Set(db.life.find().toArray().map(c => c.x + "," + c.y));
  let out = "";
  for (let y = 0; y < h; y++) {
    let line = "";
    for (let x = 0; x < w; x++) line += on.has(x + "," + y) ? "█" : "·";
    out += line + "\n";
  }
  print(out);
}
And one last loop to press play:
for (let g = 0; g <= 90; g++) {
  print("═══ generation " + g + " ═══");
  render(45, 22);
  step();
}
Because print() flushes as it goes, you don't get one big dump at the end. You watch it animate, frame by frame, right in your console:
═══ generation 42 ═══
··········································
····██····································
···█··█···································
····██·····███····························
············█·█····██·····················
···········█···█····██····················
············█·█··········█·················
·············█·······██·█·················
·····················██·███···············
·························█·················
The gun sits in the corner and fires gliders (those little five-cell arrowheads), one every 30 generations, each one computed by an aggregation pipeline. Running on nothing but your database and a for loop.
What really was displayed
Under the cover of a toy, you used a surprisingly deep slice of MongoDB:
$projectand$mapto transform and generate array data on the fly.$concatArraysto build a combined array from literals and computed values.$unwindto explode arrays into individual documents, the classic fan-out.$groupwith$sumand$maxto aggregate across the whole collection at once.$matchwith$exprto filter using computed logic, not just static field matches.- Sparse data modeling, storing only what exists instead of a dense grid.
Those aren't Game of Life tricks. $unwind into $group is how you tally line items across orders. $expr in $match is how you compare two fields in the same document. $map over an array is everyday work once your documents get nested. You just practiced all of it on gliders instead of invoices, and it stuck, because it was fun.
And you learned the bigger lesson: the shell is a creative space. It's a real language wired directly to your data. Bar charts, sparklines, simulations, little games. The same functions, loops, and print() that drew this grid can draw anything you want. Most people never find out because they stop at find().
So next time you've got the shell open and a few minutes to kill, don't just query. Build something ridiculous. Your database is more of a computer than you think.
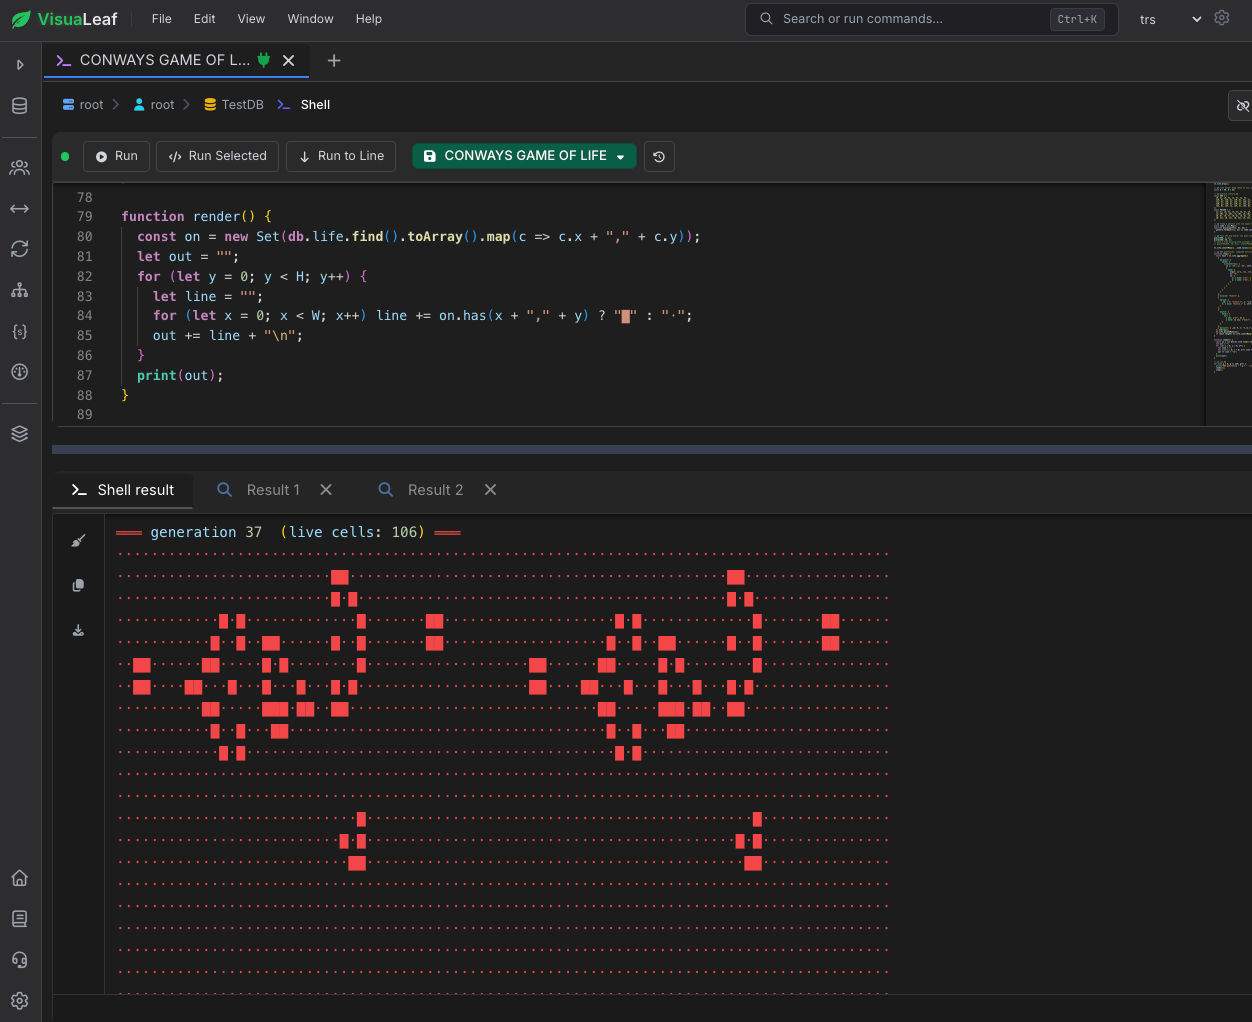
By the way, if you want the same shell interface I used for this article, try out VisuaLeaf. It runs the real MongoDB shell under the hood, so everything here (the functions, the loops, the whole Game of Life) works exactly the same, except your scripts live in a proper editor where you can save them, tweak them, and rerun them whenever instead of losing them when the terminal closes.