
VisuaLeaf is a desktop workspace for Databricks SQL: connect to a SQL warehouse, browse Unity Catalog catalogs, schemas and Delta tables, write Spark SQL, and chart the result in the same window — without opening a notebook to look at a table.
Databricks is built for pipelines and notebooks, so the quick questions — what is in this table, what type is that column, what did last night’s job write — still go through a browser workspace. VisuaLeaf gives those questions a desktop SQL client.
Unity Catalog puts every table three levels deep, often across several catalogs per workspace, so finding the one you meant is a search before it is a query.
SQL runs on a SQL warehouse you address by its HTTP path, and a client that pulls whole tables to show ten rows keeps that compute busy for nothing.
Primary and foreign keys are recorded in Unity Catalog but never enforced, and there are no indexes, so the model lives in naming conventions.
Checking a row or a column type should not mean attaching a cluster to a notebook in a browser tab.
Browse Unity Catalog, inspect Delta tables, write Spark SQL, and chart results — all in one workspace.
Unity Catalog’s three levels, Delta tables, SQL warehouses, and results that want to be charts, explored and visualized instead of parsed from text.
Browse catalogs, schemas, tables and views the way Unity Catalog organises them. Leave the catalog blank to start in the workspace default, or name one; create new schemas from the tree, and read every column with its Spark SQL type.
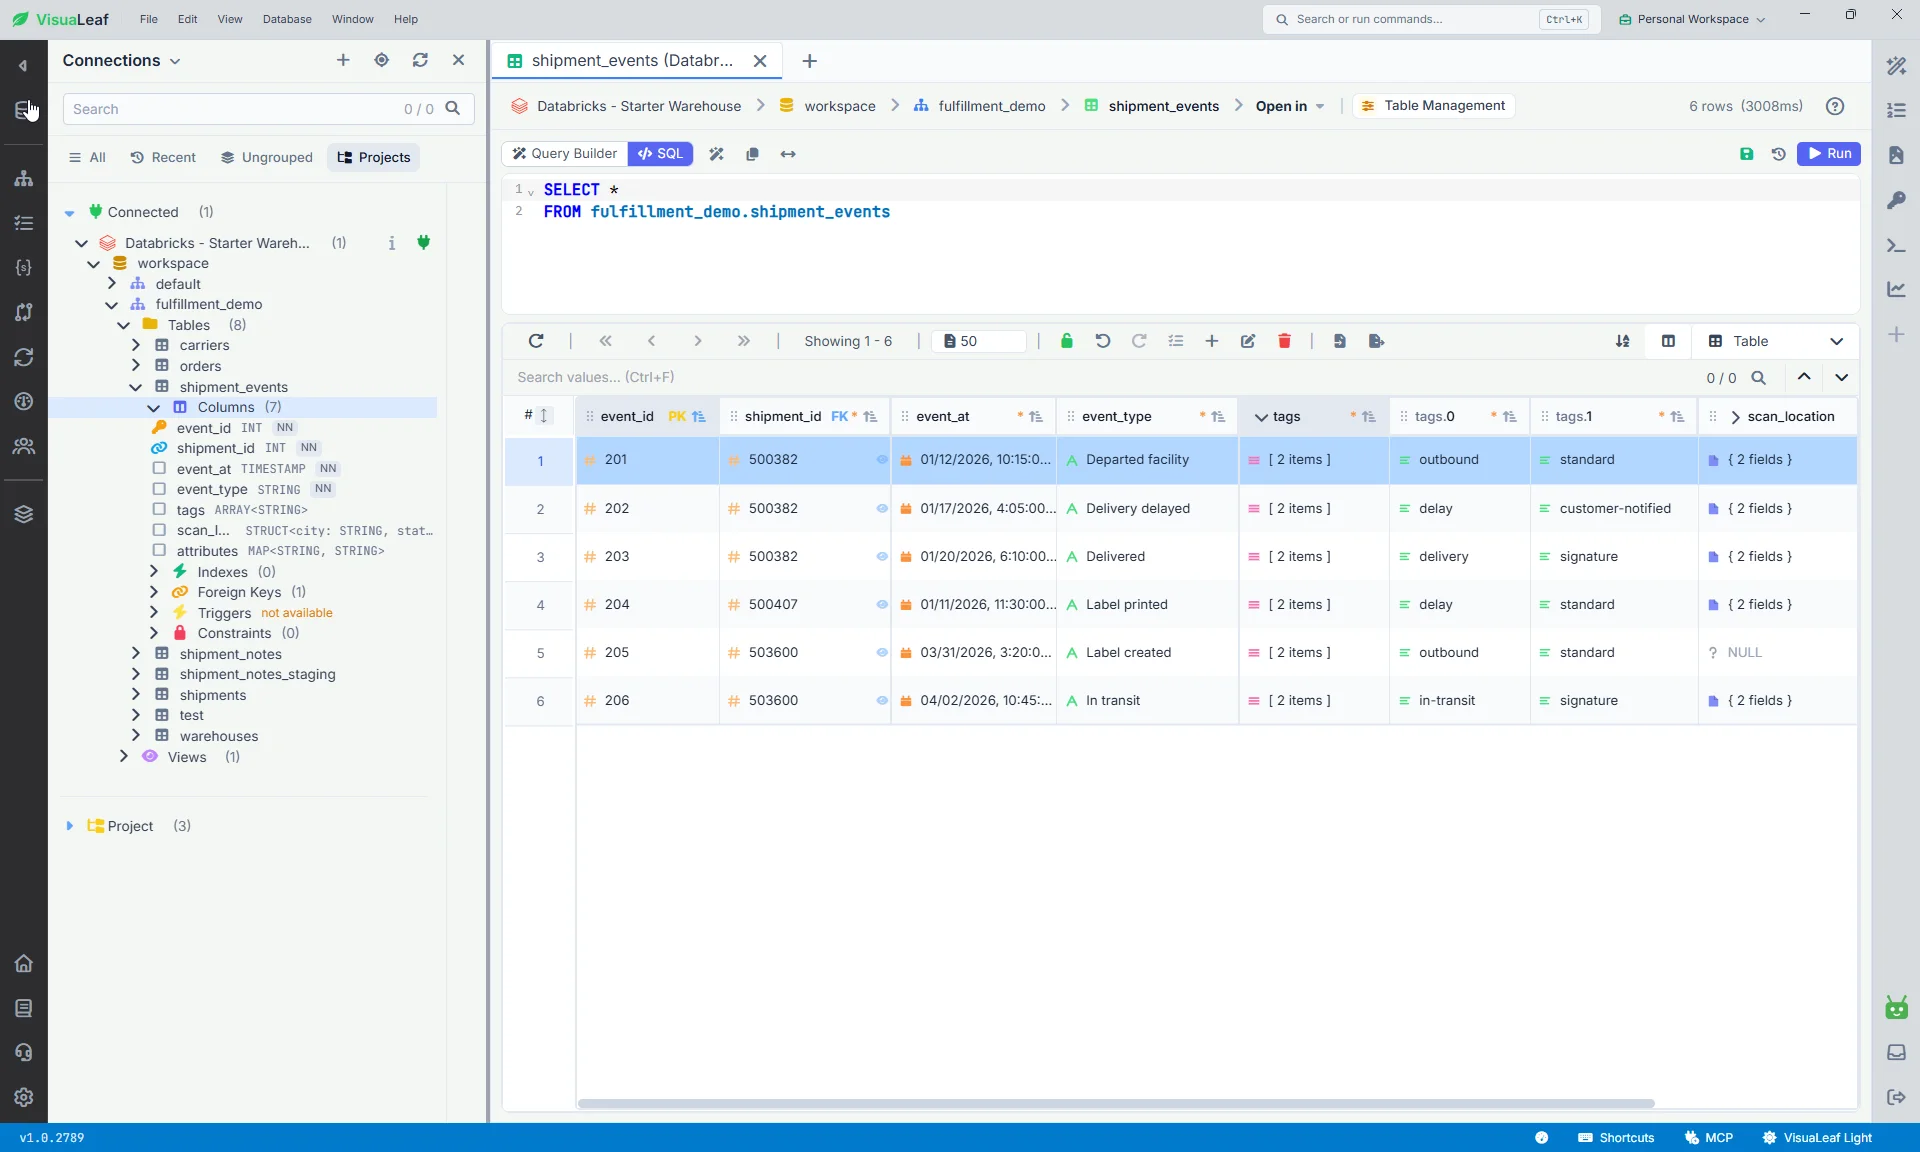
Open a Delta table and page through it in a grid instead of a notebook cell, with columns typed — STRING, DECIMAL, TIMESTAMP, TIMESTAMP_NTZ, VARIANT — and results fetched a page at a time so a quick look stays a quick look.
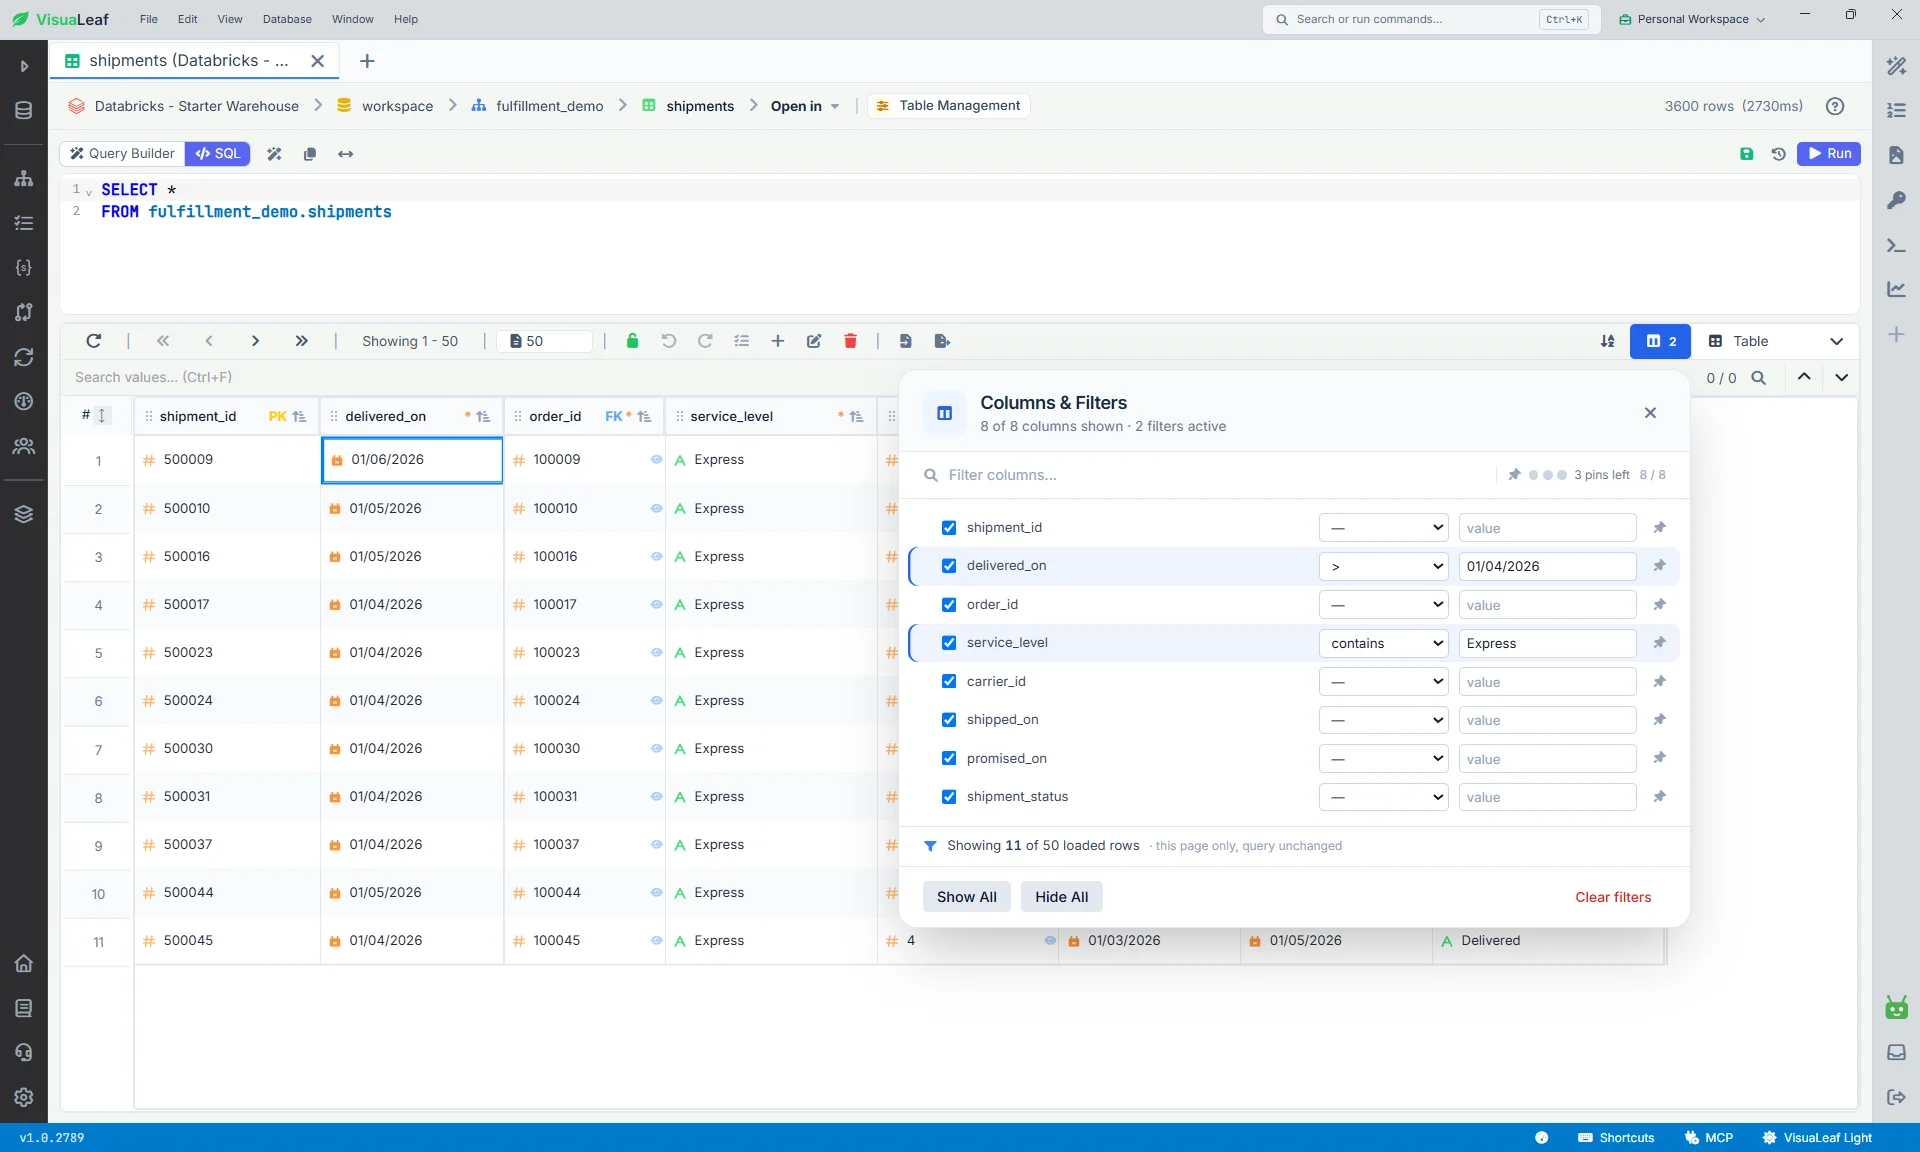
Write Spark SQL against your SQL warehouse or assemble joins, filters and grouping visually, then turn the result into a chart or a dashboard tile without exporting it to another tool.
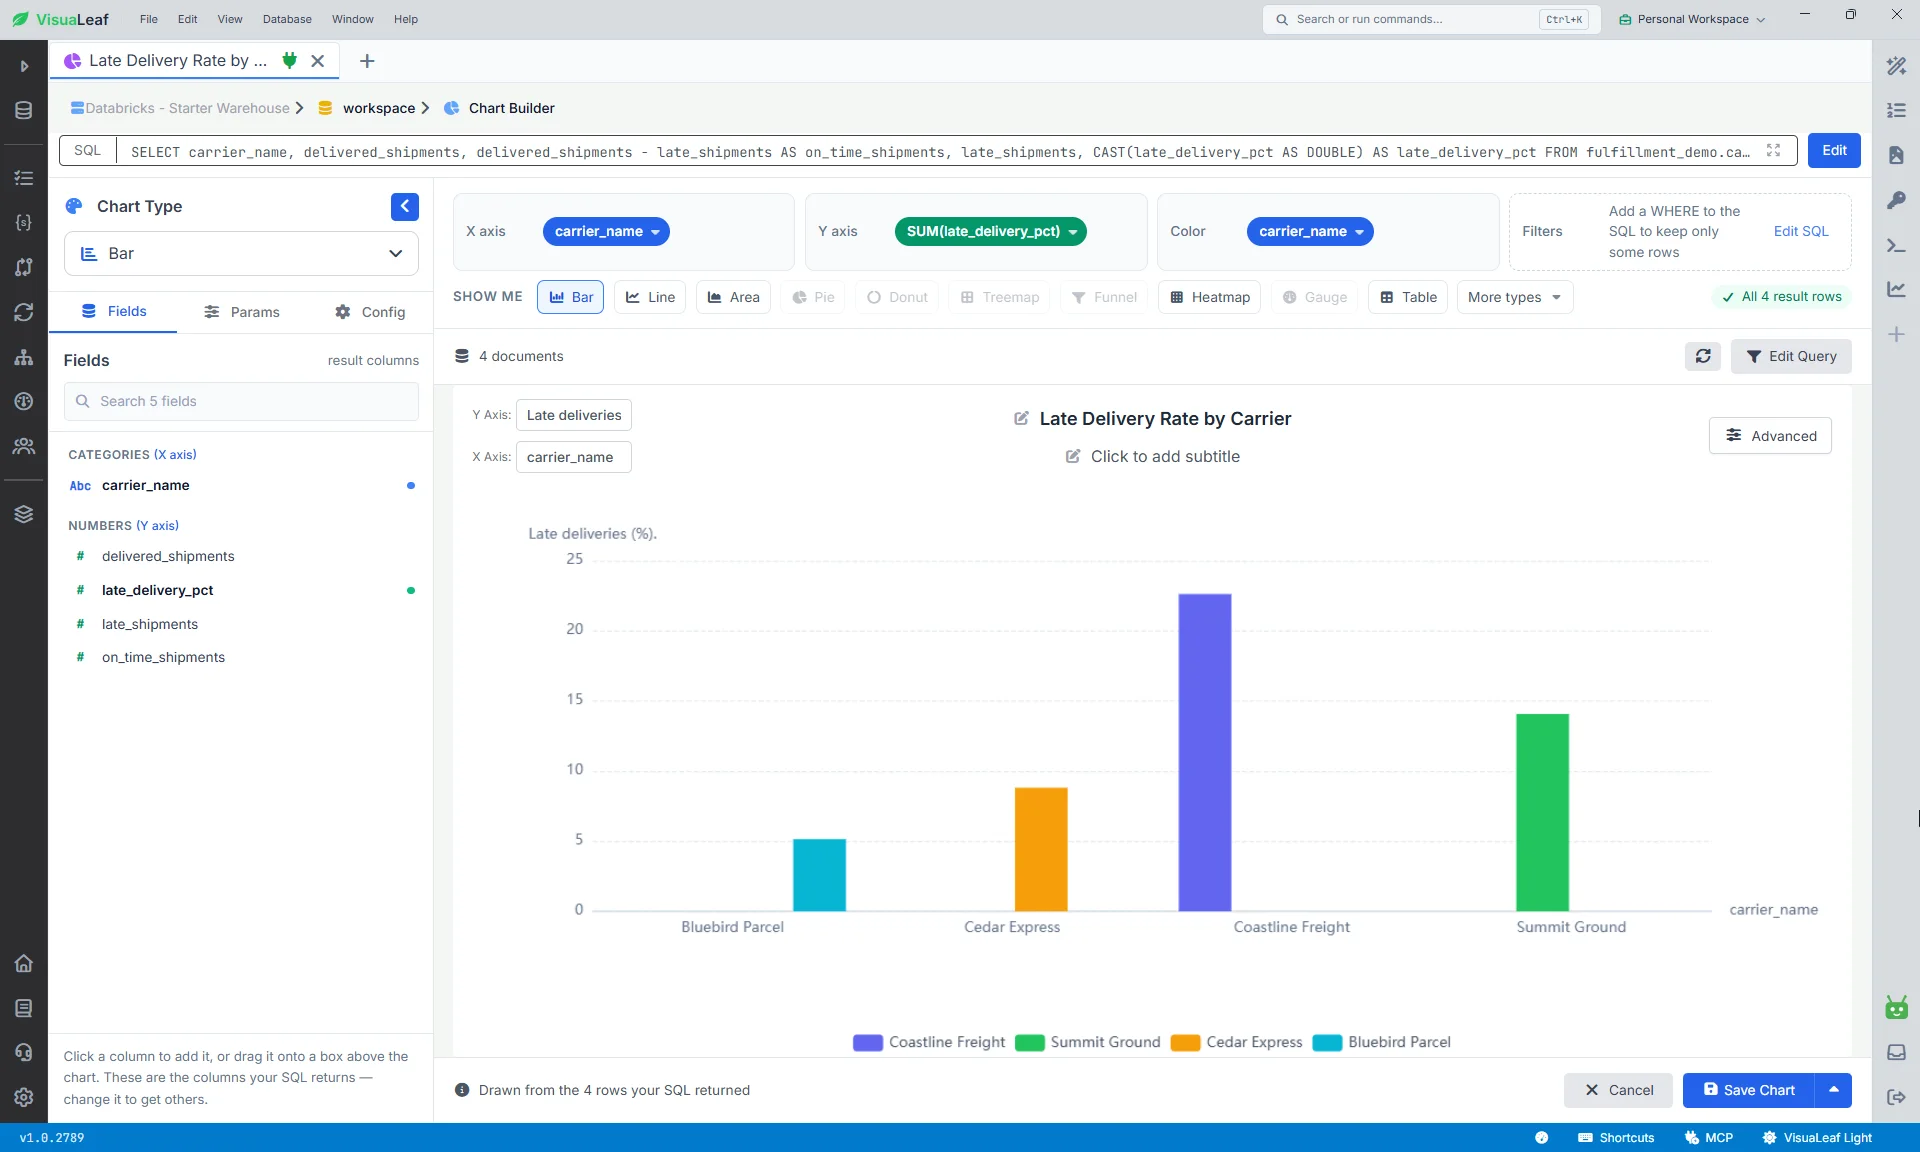
VisuaLeaf connects the steps Databricks users usually handle separately: connect to a SQL warehouse, explore Unity Catalog, write Spark SQL, and turn results into charts.
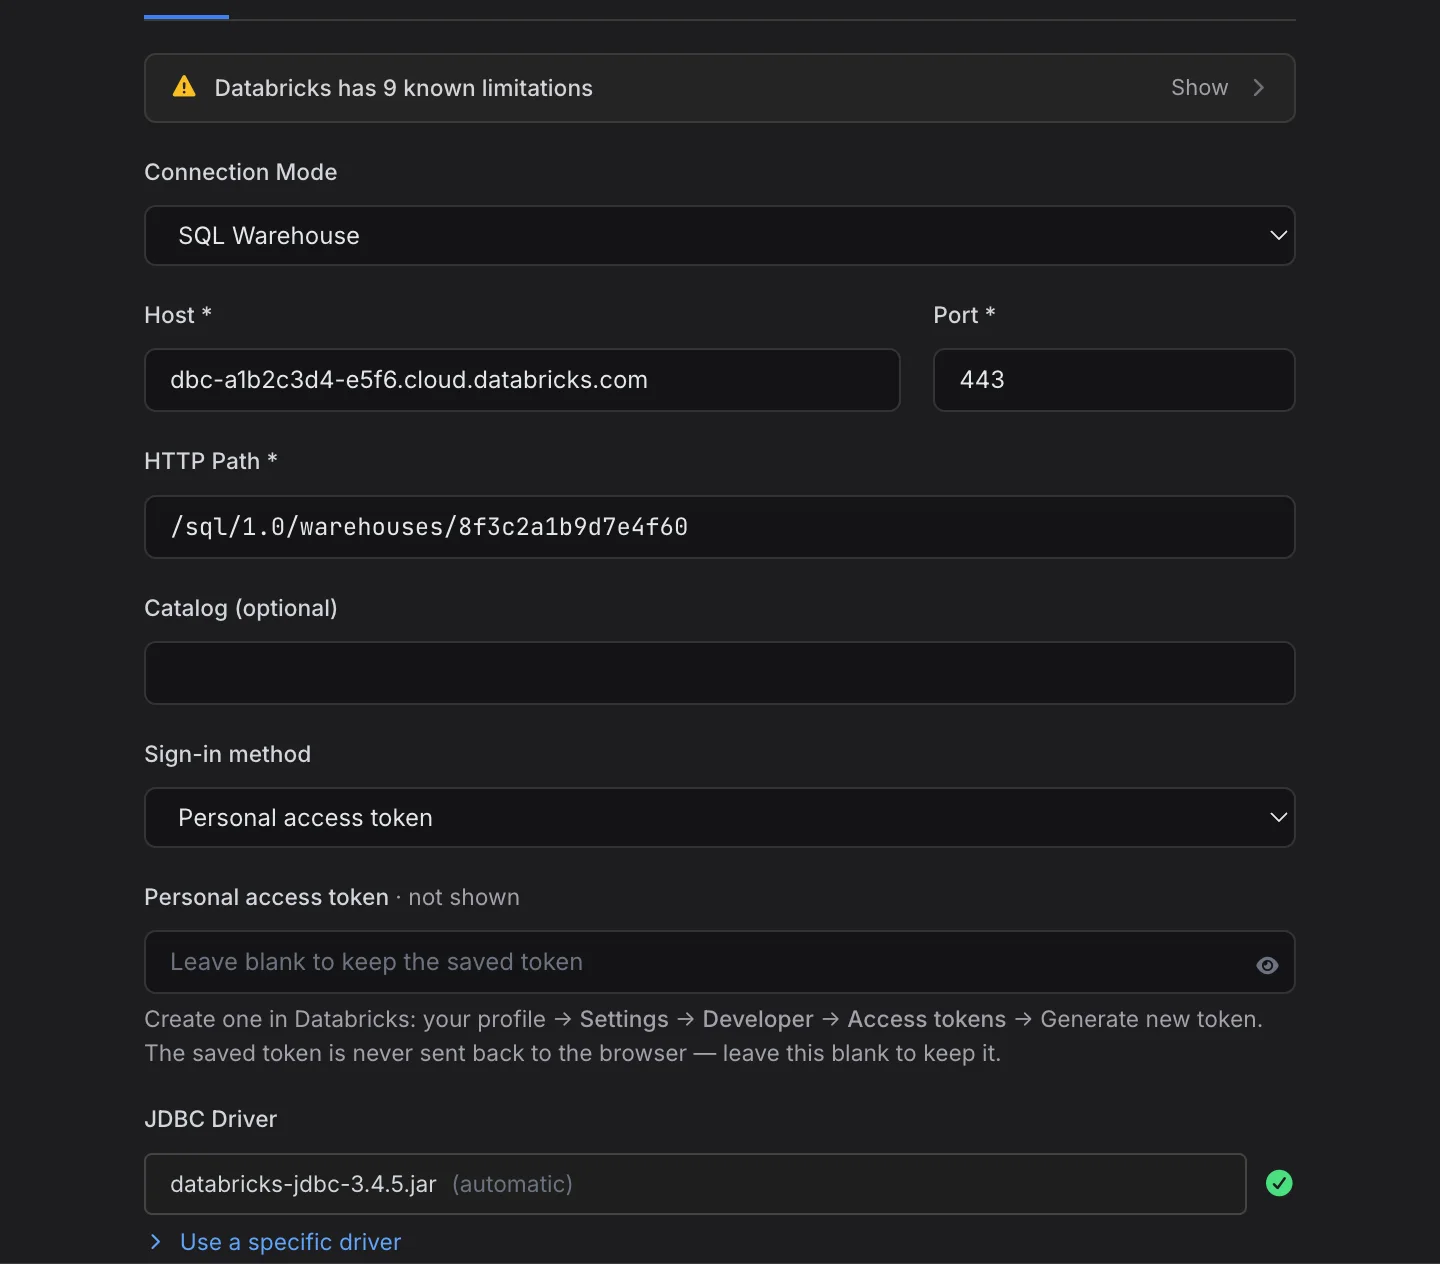
Connect with your workspace host and SQL warehouse HTTP path, signing in with a personal access token or OAuth.
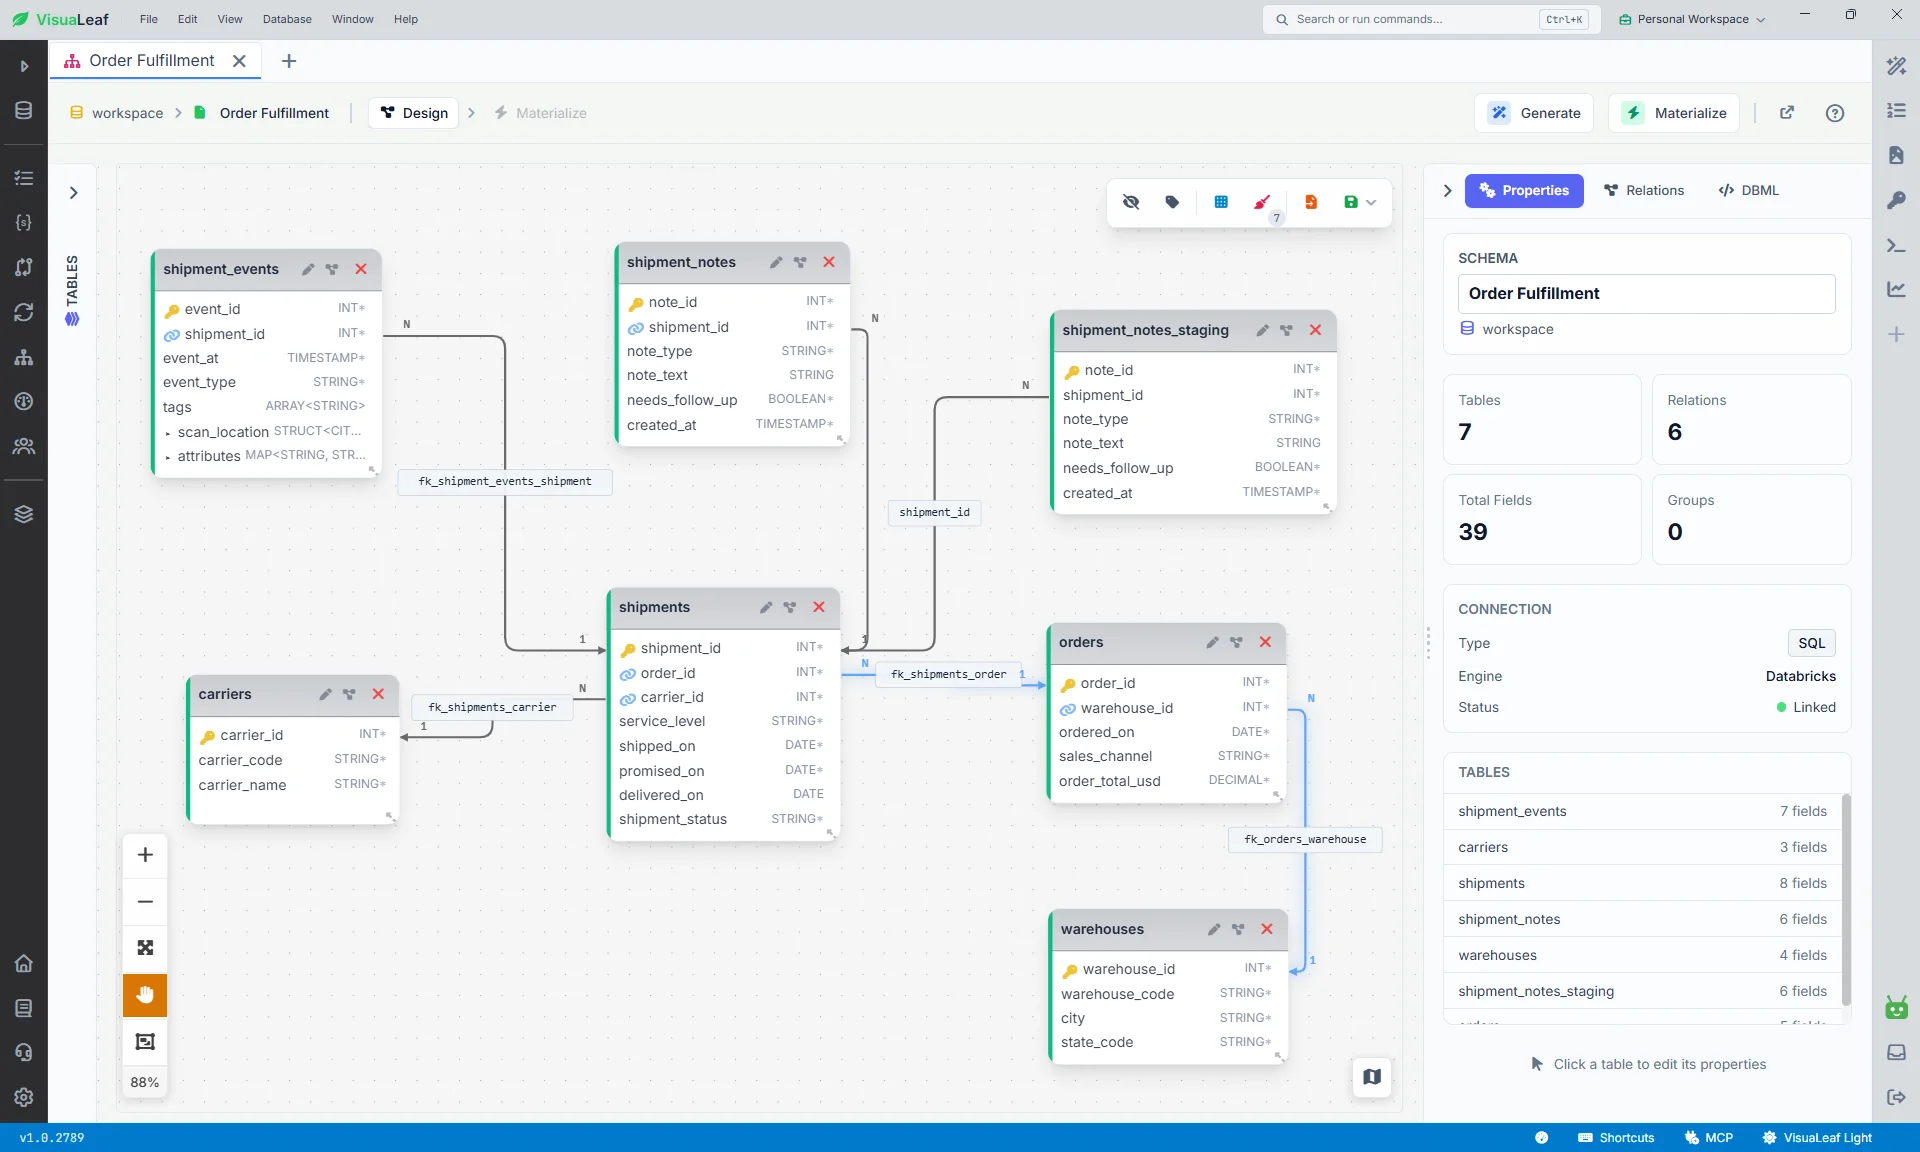
Browse catalogs, schemas, tables and views, read every column with its Spark SQL type, and see how tables relate in an ER diagram.
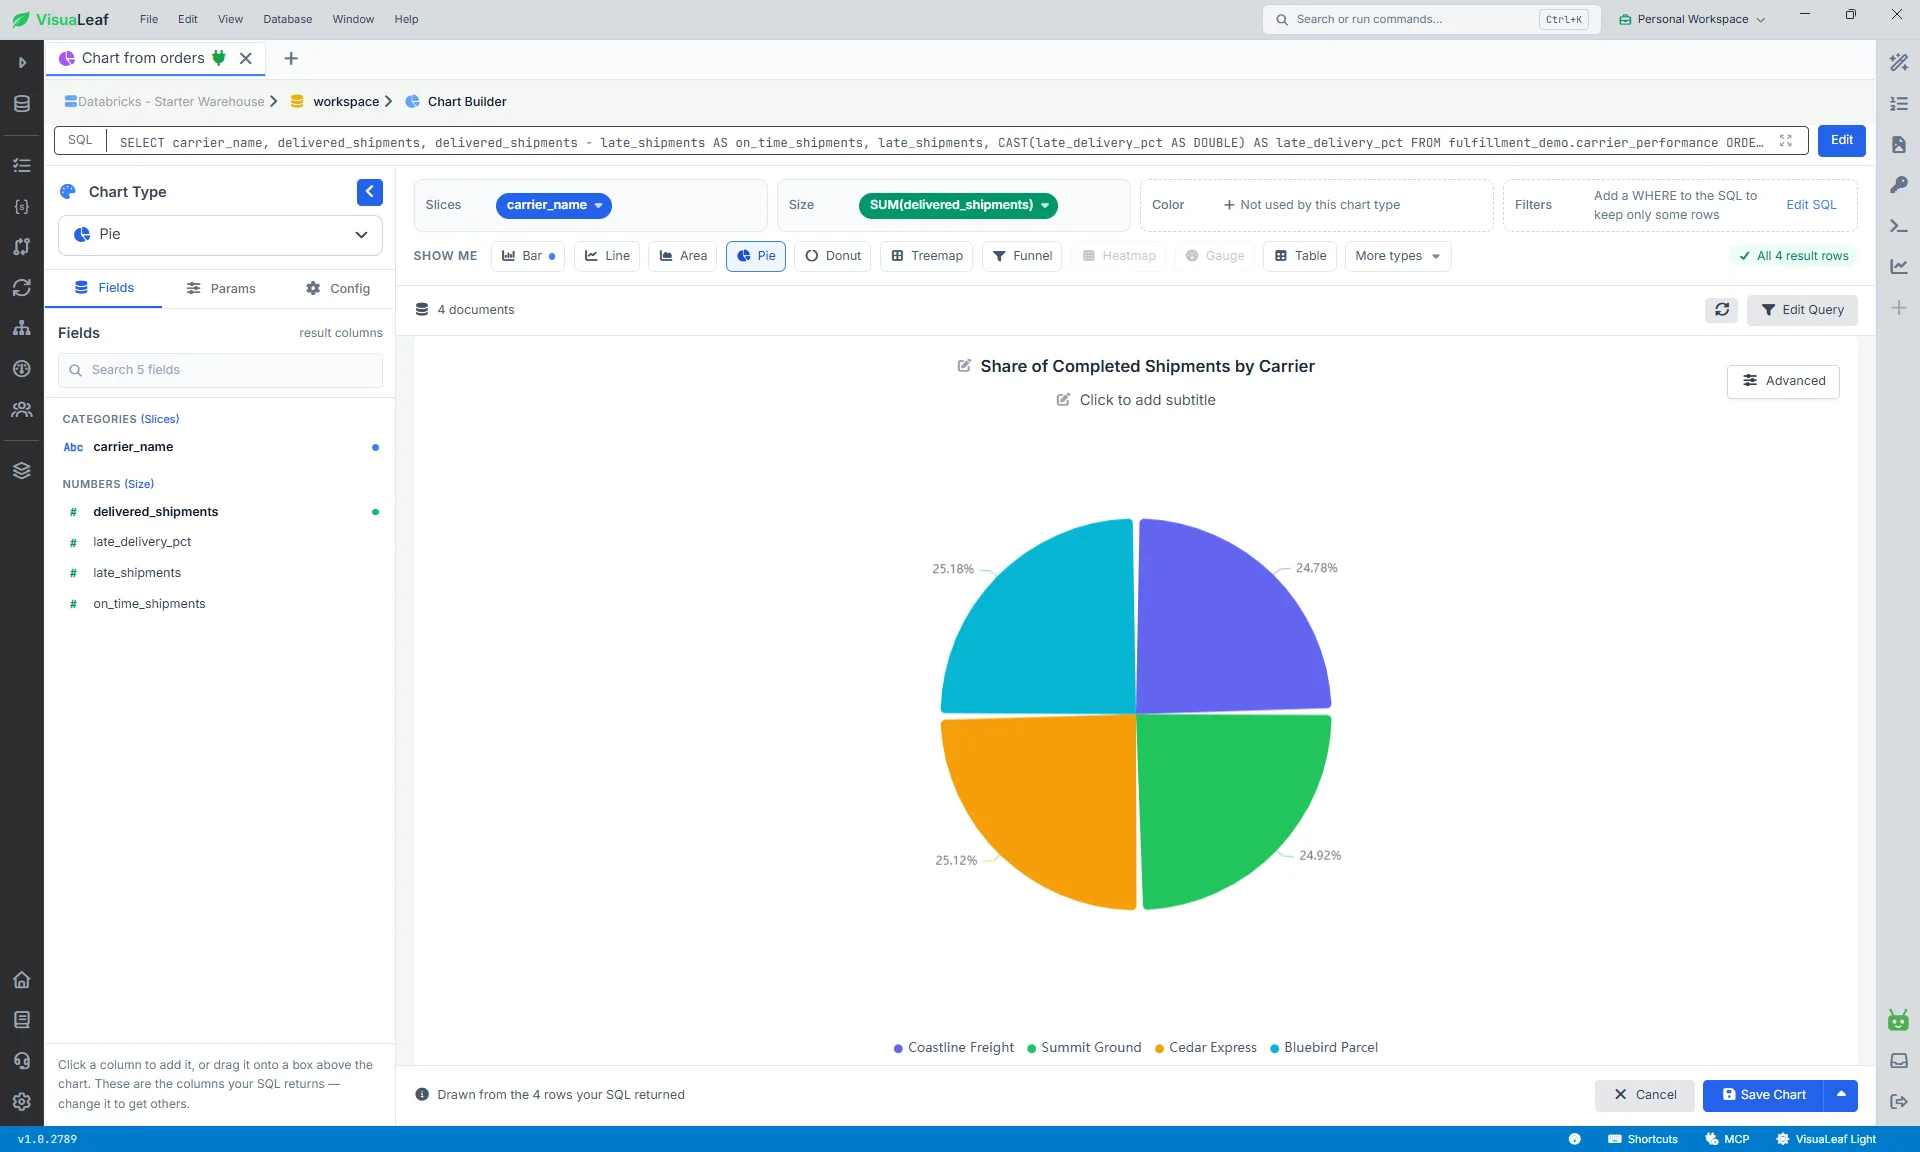
Assemble joins, filters and grouping visually or write Spark SQL by hand, then chart the result.
Whether you build on the lakehouse, run the pipelines that feed it, answer questions with SQL, or are learning it, VisuaLeaf gives you a clearer way to work with Databricks SQL.
Check what a job wrote to a Delta table and test the Spark SQL your application runs, without opening a notebook.
Review catalogs, schemas and table definitions across workspaces from one desktop client.
Write aggregations and window functions against a SQL warehouse and chart the results without a separate BI tool.
Learn Spark SQL visually, see how Unity Catalog is organised, and read the SQL the query builder writes.
VisuaLeaf started as a MongoDB workspace and grew into a multi-database visual environment. One app, one workflow, across the databases your team actually uses.
And VisuaLeaf does not leave you staring at a wall of SQL and grids. It visualizes everything — lakehouse results become charts, queries become visual builders, and Unity Catalog becomes a tree you can browse.
VisuaLeaf is made by an independent software studio that ships often and listens to the developers who use it every day.
Download VisuaLeaf Community Edition and browse Unity Catalog, open Delta tables, write Spark SQL, and chart the results in one visual workspace.
Download Free Community Edition