
VisuaLeaf is a desktop workspace for Google BigQuery, the serverless warehouse that bills every byte a query scans: browse projects, datasets and tables, see what a query will cost before it runs, write GoogleSQL, and chart the result in the same window.
There is no server to size and no index to tune, so the cost of a query is decided by how much it reads. VisuaLeaf puts that number in front of you before anything runs, and makes the reading you do afterwards visual instead of a grid of text.
BigQuery bills the columns a query scans, not the rows it returns, so SELECT * ... LIMIT 10 on a wide table costs the whole table.
Data lives three levels deep and often across several projects, so finding the right table is a task of its own before any SQL is written.
Primary and foreign keys can be declared but are never enforced, and there are no indexes, so how tables relate is something the team remembers.
Warehouse answers are small and shaped — totals by week, counts by region — yet the console hands them back as rows to copy somewhere else.
Browse datasets, check the scan size, write GoogleSQL, and chart results — all in one workspace.
Projects and datasets, a per-byte bill, GoogleSQL types, and results that want to be charts, explored and visualized instead of parsed from text.
Browse a project the way BigQuery organises it: datasets, then tables and views, loaded as you open them rather than all at once. Read every column with its GoogleSQL type — INT64, NUMERIC, GEOGRAPHY, JSON — and page through rows of an unfiltered table, which BigQuery serves without a billed query.
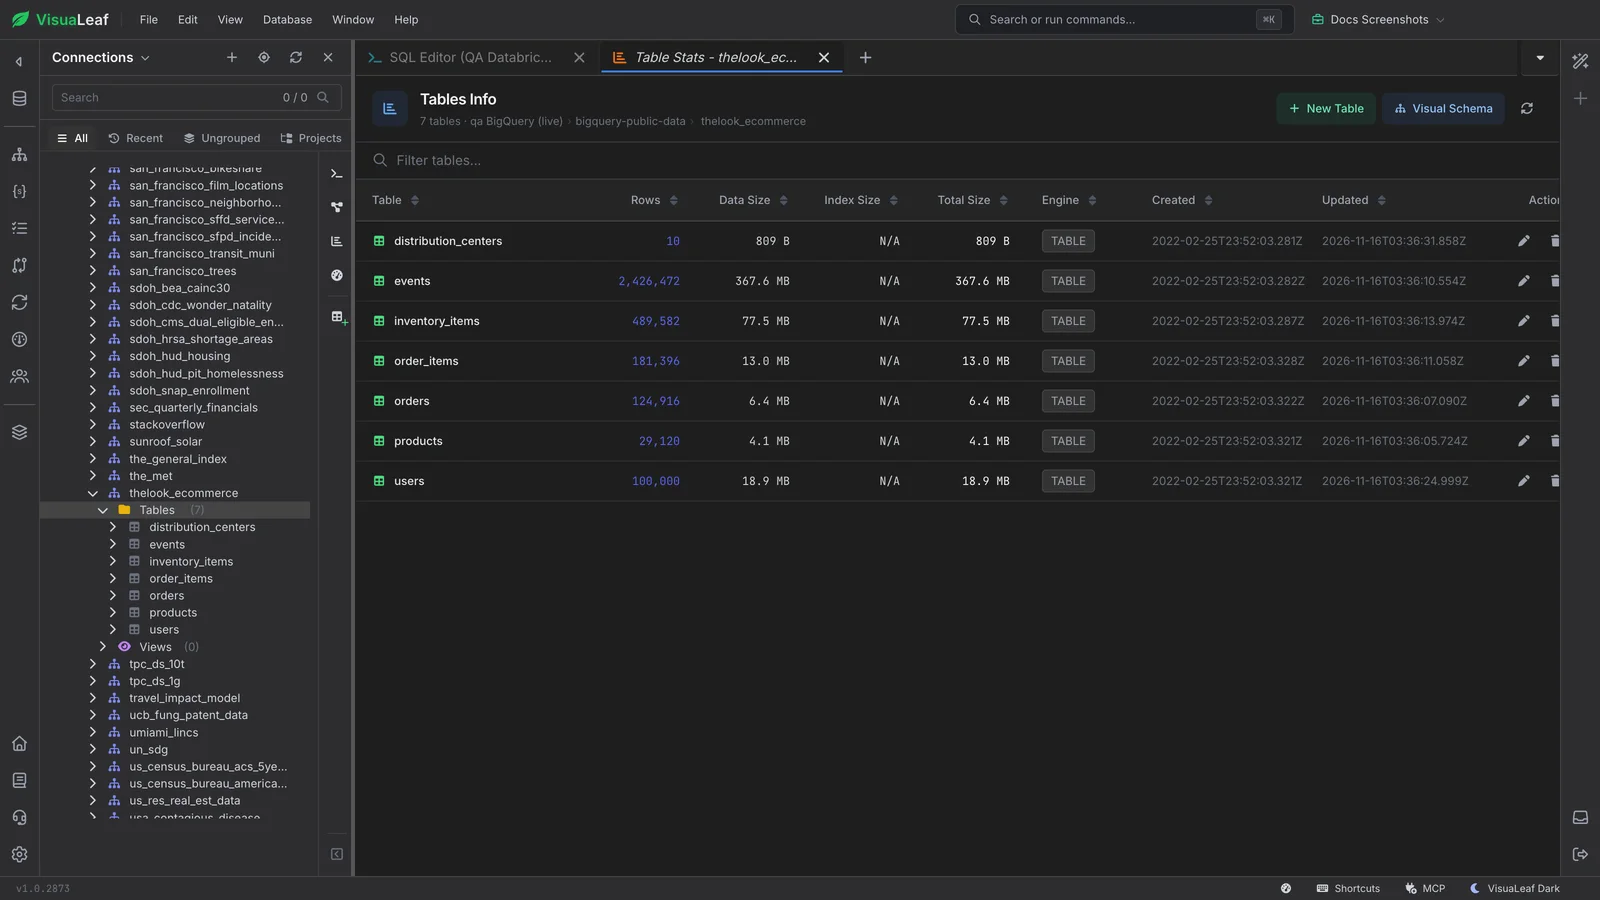
Every query, filtered table page, chart and scheduled task is priced with BigQuery’s own dry run first. Small reads run straight away, anything over 100 MB shows its size and price and asks first, and every connection carries a MaximumBytesBilled ceiling — 1 GB unless you raise it — that BigQuery itself enforces.
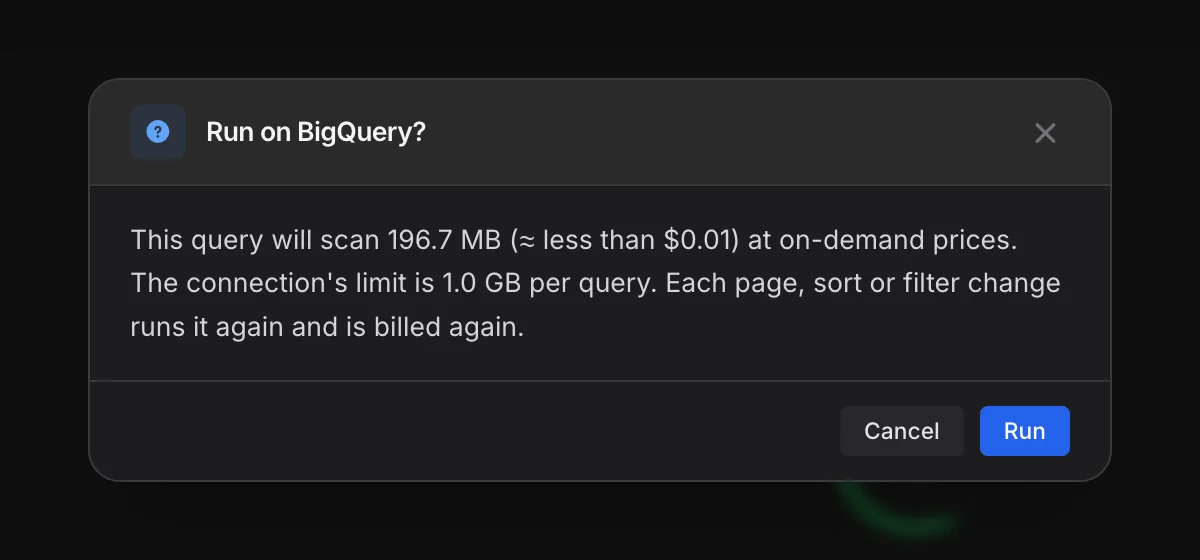
Turn a query result into a chart without exporting it, pin charts to a dashboard, and know what a refresh will cost — saved charts and tasks are priced again each time they run, so the warehouse never bills you by surprise.
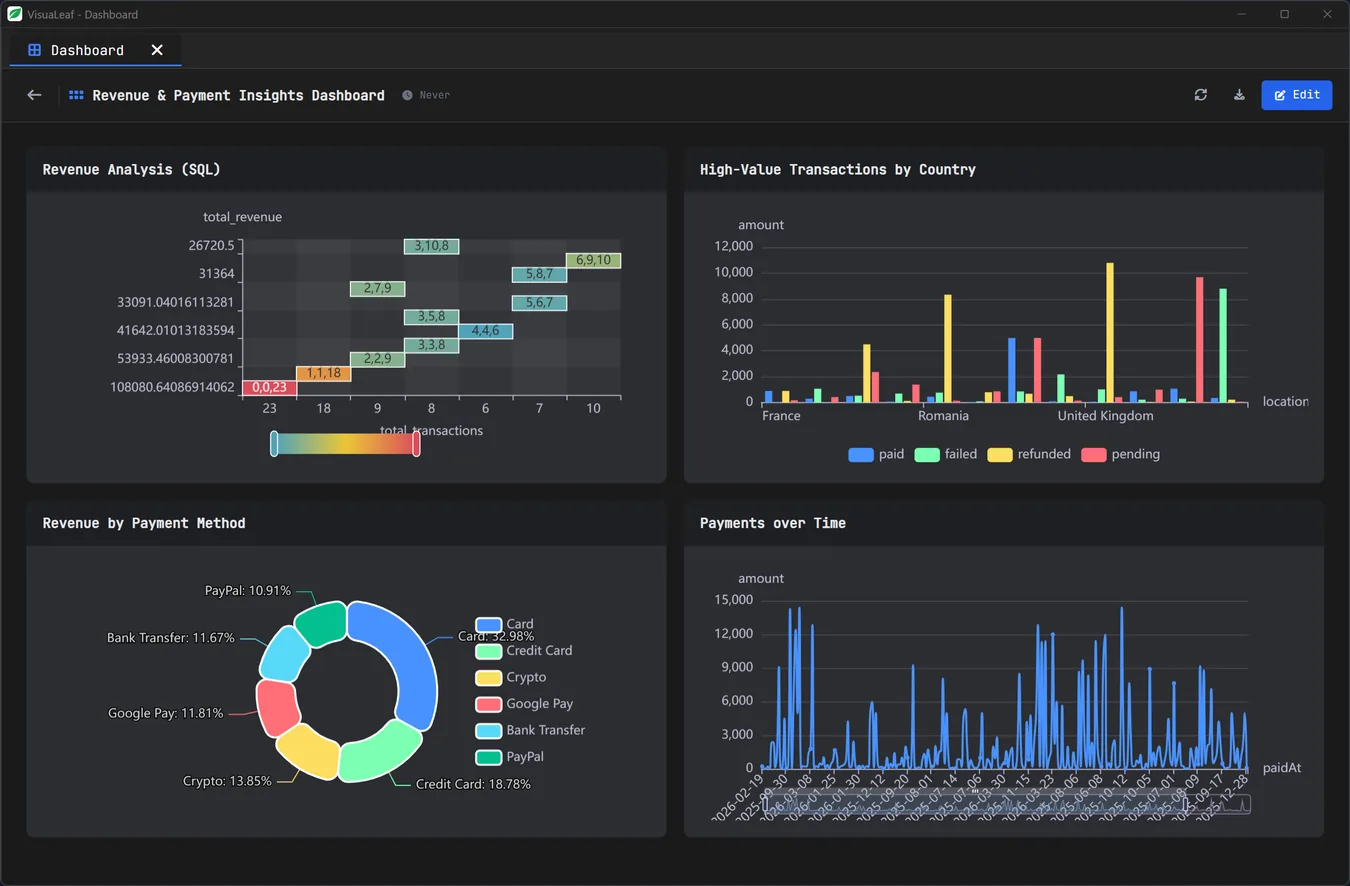
VisuaLeaf connects the steps BigQuery users usually handle separately: sign in to a project, explore datasets and tables, check what a query will scan, and turn results into charts.
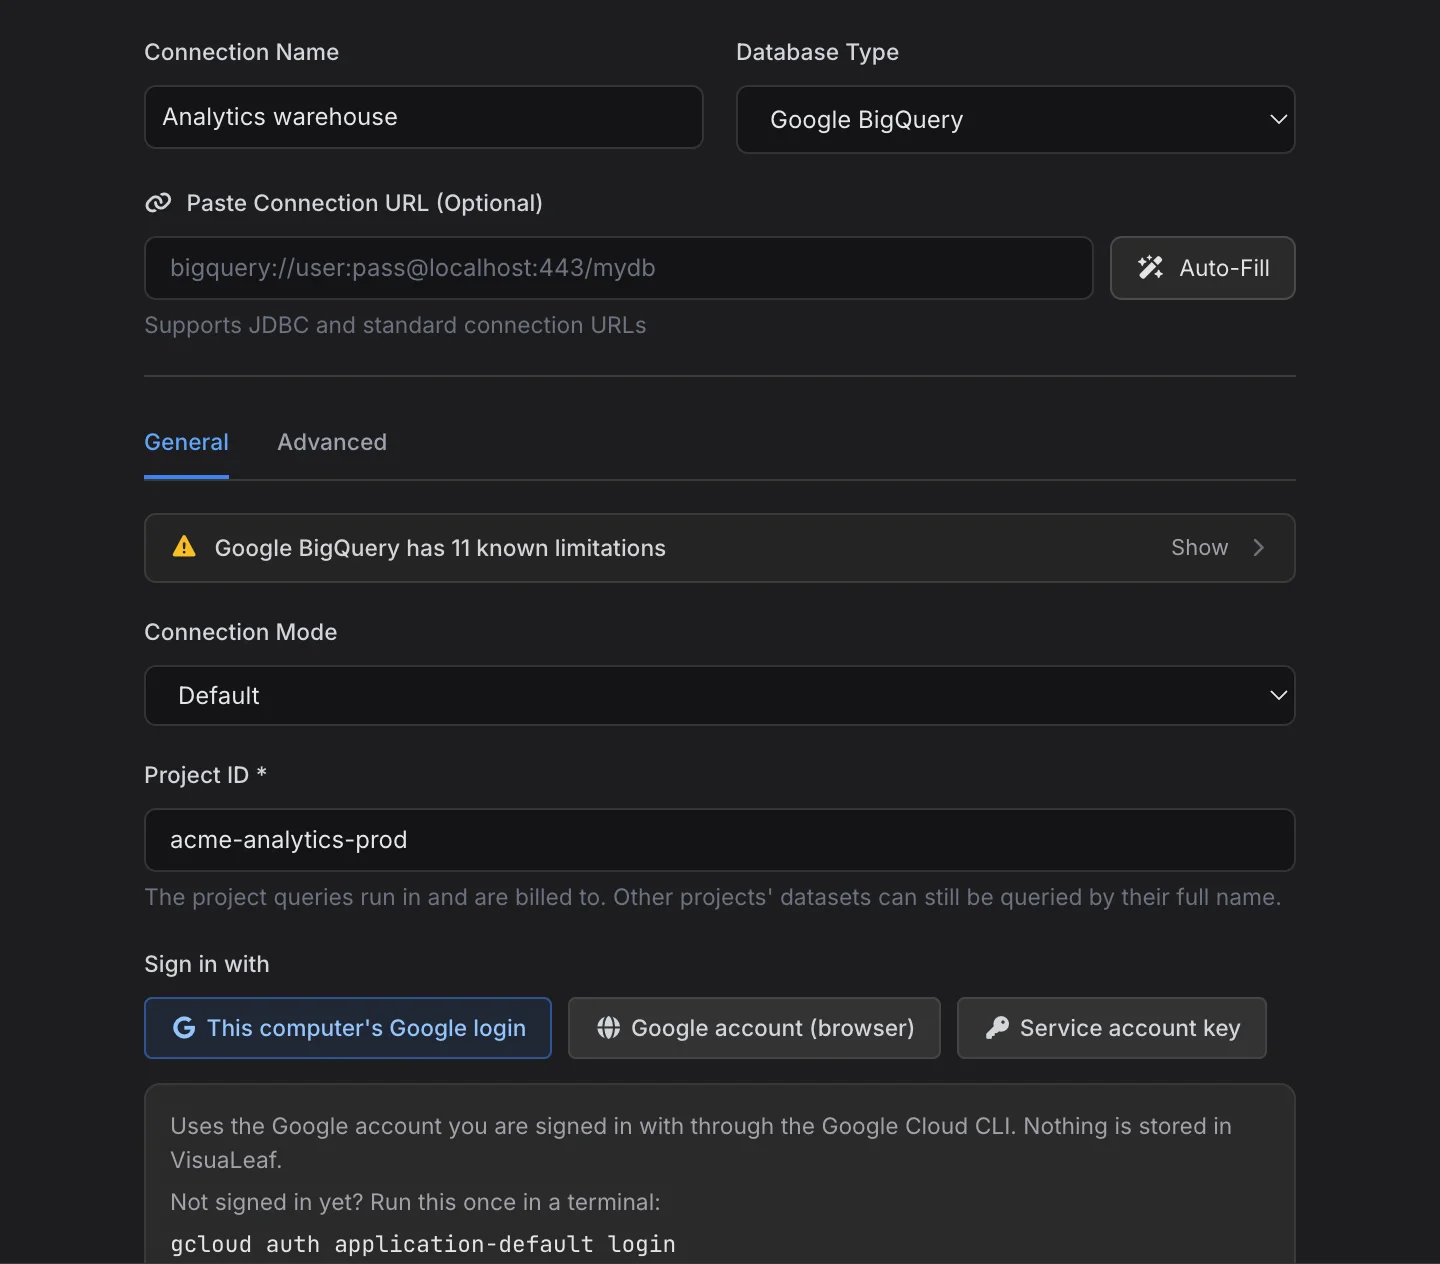
Connect with a billing project ID, then sign in with your gcloud login, a Google account in the browser, or a service-account JSON key.
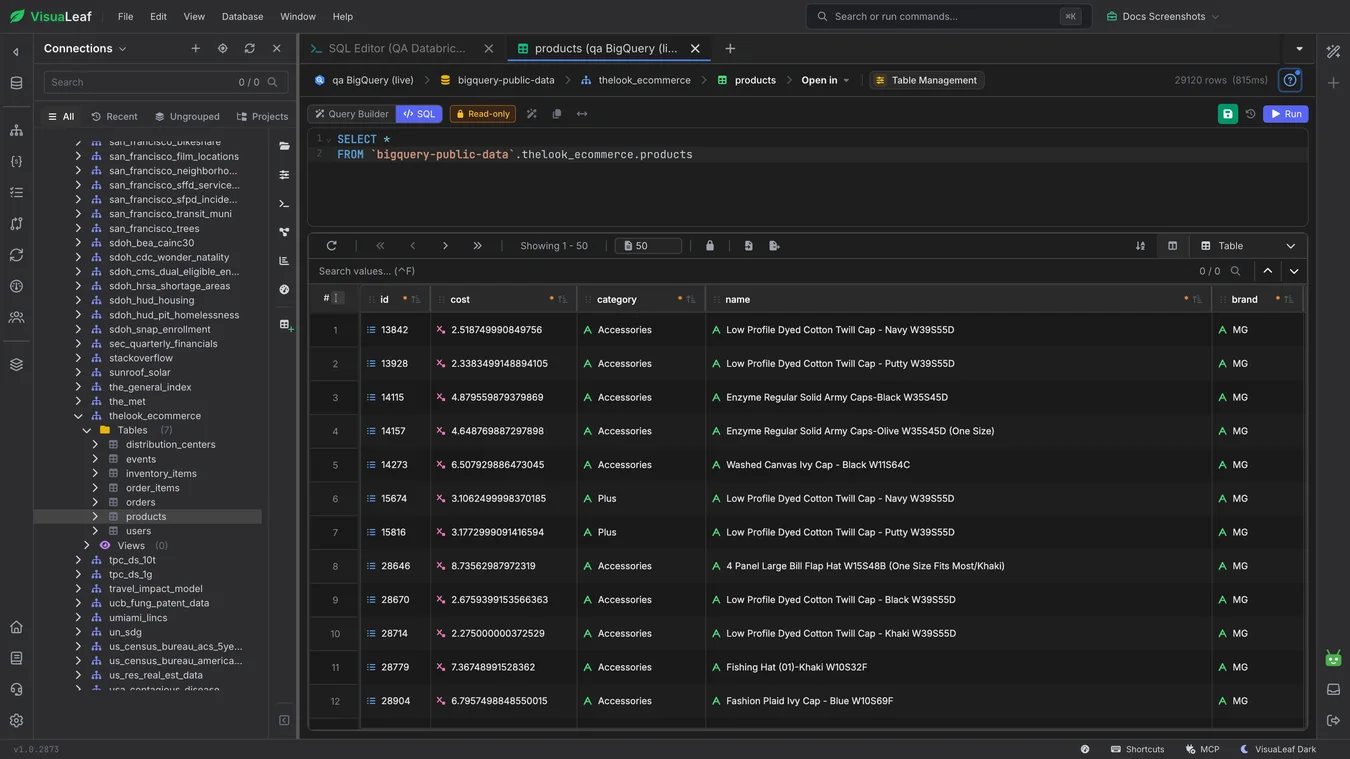
Browse datasets, tables and views, read GoogleSQL column types, and page through table rows.
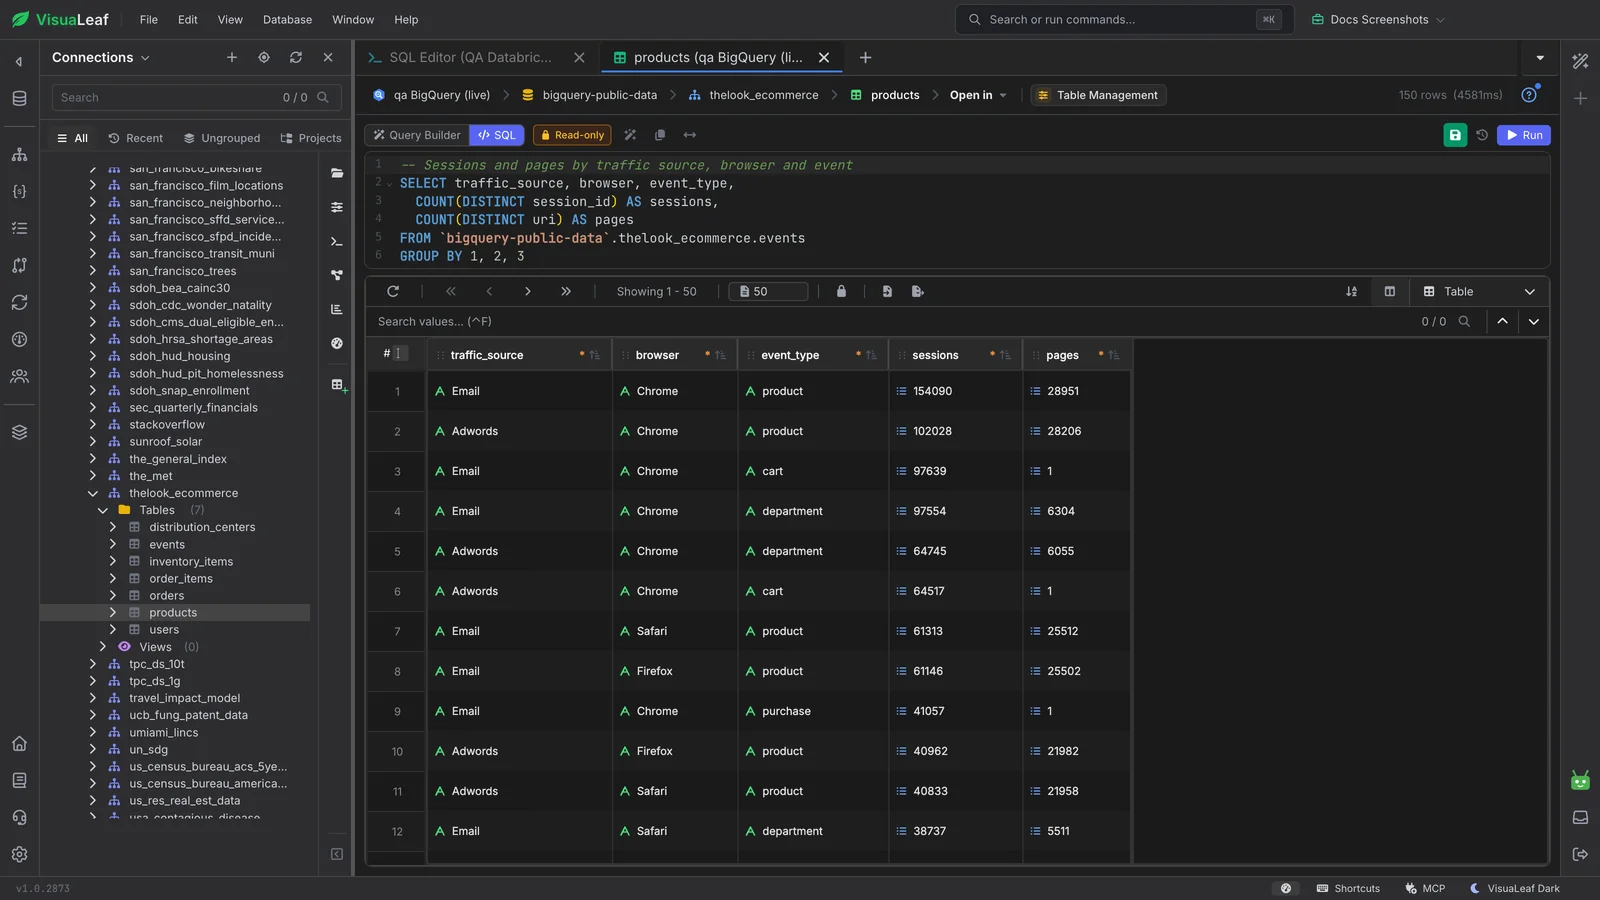
Write GoogleSQL with the scan size in view, run it inside your byte ceiling, then chart the result.
Whether you build on BigQuery, run pipelines into it, answer questions with SQL, or are learning it, VisuaLeaf gives you a clearer — and cheaper — way to work with your warehouse.
Check what your application or pipeline wrote, and test the GoogleSQL it runs, with the cost of each query in view.
Review datasets and table definitions across projects from one desktop workspace instead of a stack of browser tabs.
Write aggregations and window functions, see what they will scan, and chart the results without a separate BI tool.
Learn GoogleSQL visually, with a cost estimate on every query so experimenting never runs up a bill.
VisuaLeaf started as a MongoDB workspace and grew into a multi-database visual environment. One app, one workflow, across the databases your team actually uses.
And VisuaLeaf does not leave you staring at a wall of SQL and grids. It visualizes everything — warehouse results become charts, queries become visual builders, and every scan is priced before it runs.
VisuaLeaf is made by an independent software studio that ships often and listens to the developers who use it every day.
Download VisuaLeaf Community Edition and browse BigQuery datasets, see what each query will scan, write GoogleSQL, and chart the results in one visual workspace.
Download Free Community Edition