How to Use DuckDB for Local Data Analysis
Learn how to use DuckDB for local analysis: open a database, query CSV and Parquet files, inspect relationships, edit data, and create charts.


You have data on your computer and want to explore it with SQL. It might be a CSV export, an existing database, or files produced by another analytical tool. Setting up a database server just to answer a few questions adds work before you have learned anything from the data.
DuckDB offers a simpler option for this kind of local analysis. It runs directly on your computer, stores data in a local file, and lets you query external files without importing everything first.
This guide follows the workflow we tested on Windows: create a persistent database, open it in a visual client, inspect and edit its data, query CSV and Parquet files, view an ER diagram, and chart the results. It also covers a limitation we found while updating a nested value on a table with a primary key.
What Is DuckDB?
DuckDB is an in-process analytical database. It runs inside the application using it rather than as a separate database server. It is built mainly for analytical queries that scan, filter, join, group, and summarize many rows. These are often called OLAP workloads.
You can save tables and views in a persistent .duckdb file, or create an in-memory database for temporary work. A persistent file remains after the application closes. An in-memory database disappears when the process ends. In a normal local setup, there is no host, port, username, or password to configure. You open a file path and start working with SQL. The official connection guide explains both modes.
The database can also run inside applications written in Python, R, Java, Node.js, and other languages through its client APIs. This does not mean those languages run inside a normal SQL editor. The application connects to the database and sends SQL through a library; the editor itself still executes SQL.
How Is It Different from Traditional Databases?
MySQL and PostgreSQL normally run as database servers. An application connects through a host and port and authenticates with a user account. That model suits applications with many users, frequent writes, user permissions, and continuous transactional traffic.
With an embedded database, you can open one local file from a command-line tool, programming language, or GUI. Use a server when several users or applications must write continuously. Use a local OLAP database when your main work is reading, joining, grouping, and summarizing data.
When Should You Use DuckDB?
It is a good fit when you need to:
- inspect a CSV export from another application;
- analyze one or more Parquet files;
- prototype an analytical query before moving it into a larger pipeline;
- create a small persistent database for local reporting;
- add analytical SQL to a Python, R, or Java application.
For our test, we created a retail analytics database containing customers, products, orders, order items, and clickstream events. It gave us primary keys, foreign keys, constraints, nested data types, and files that we could query alongside the tables.
How Do You Create and Open a Local Database?
After downloading the Windows command-line client, pass it the path where you want to store the database:
& "C:\Program Files\DuckDB\duckdb.exe" "C:\DuckDB\visualeaf_demo.duckdb"
If the file does not exist, this command creates it. If it already exists, the same command opens it. Use a file instead of :memory: when you want to keep your tables, views, and data between sessions.
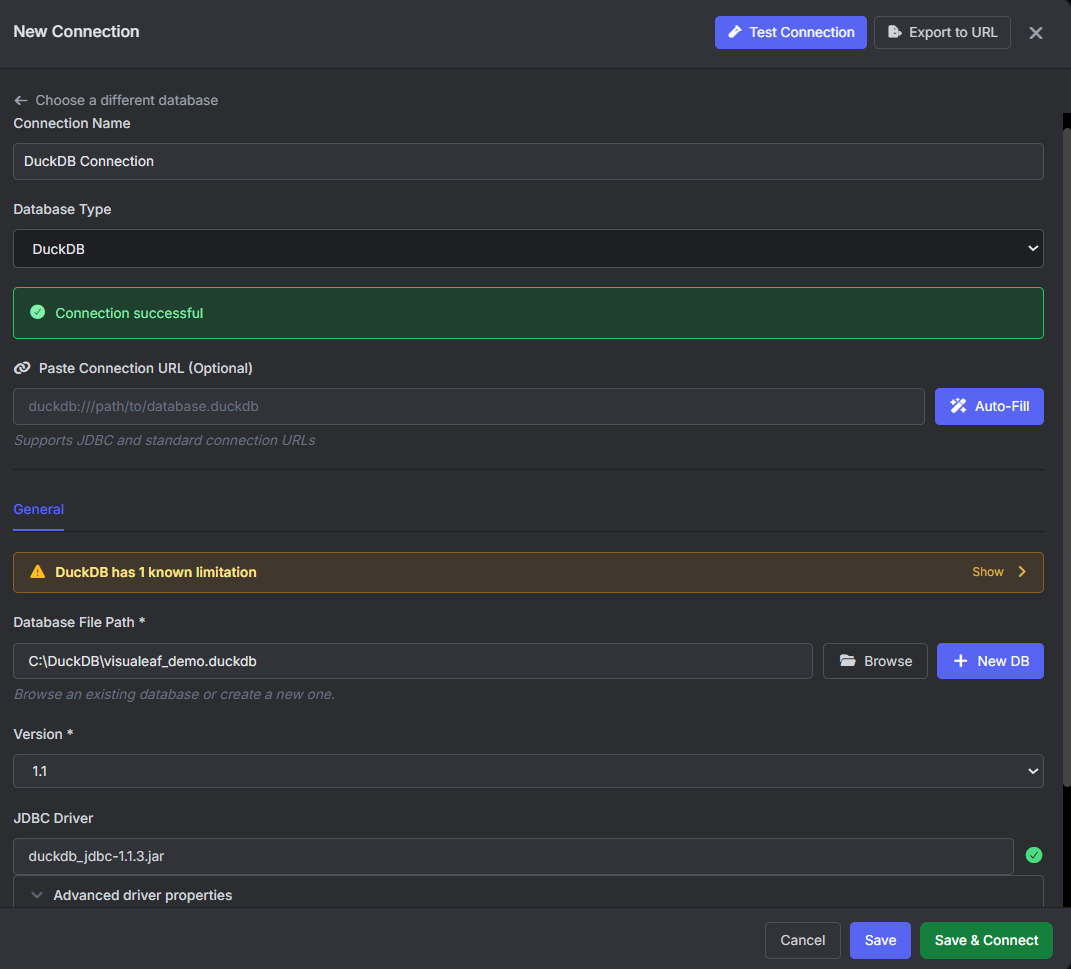
To open the same database in VisuaLeaf, create a connection and select:
C:\DuckDB\visualeaf_demo.duckdb
No server credentials are required. After connecting, refresh the sidebar to browse the schemas, tables, views, columns, constraints, and indexes available in the file.
How Can You Browse and Edit DuckDB Data with a GUI?
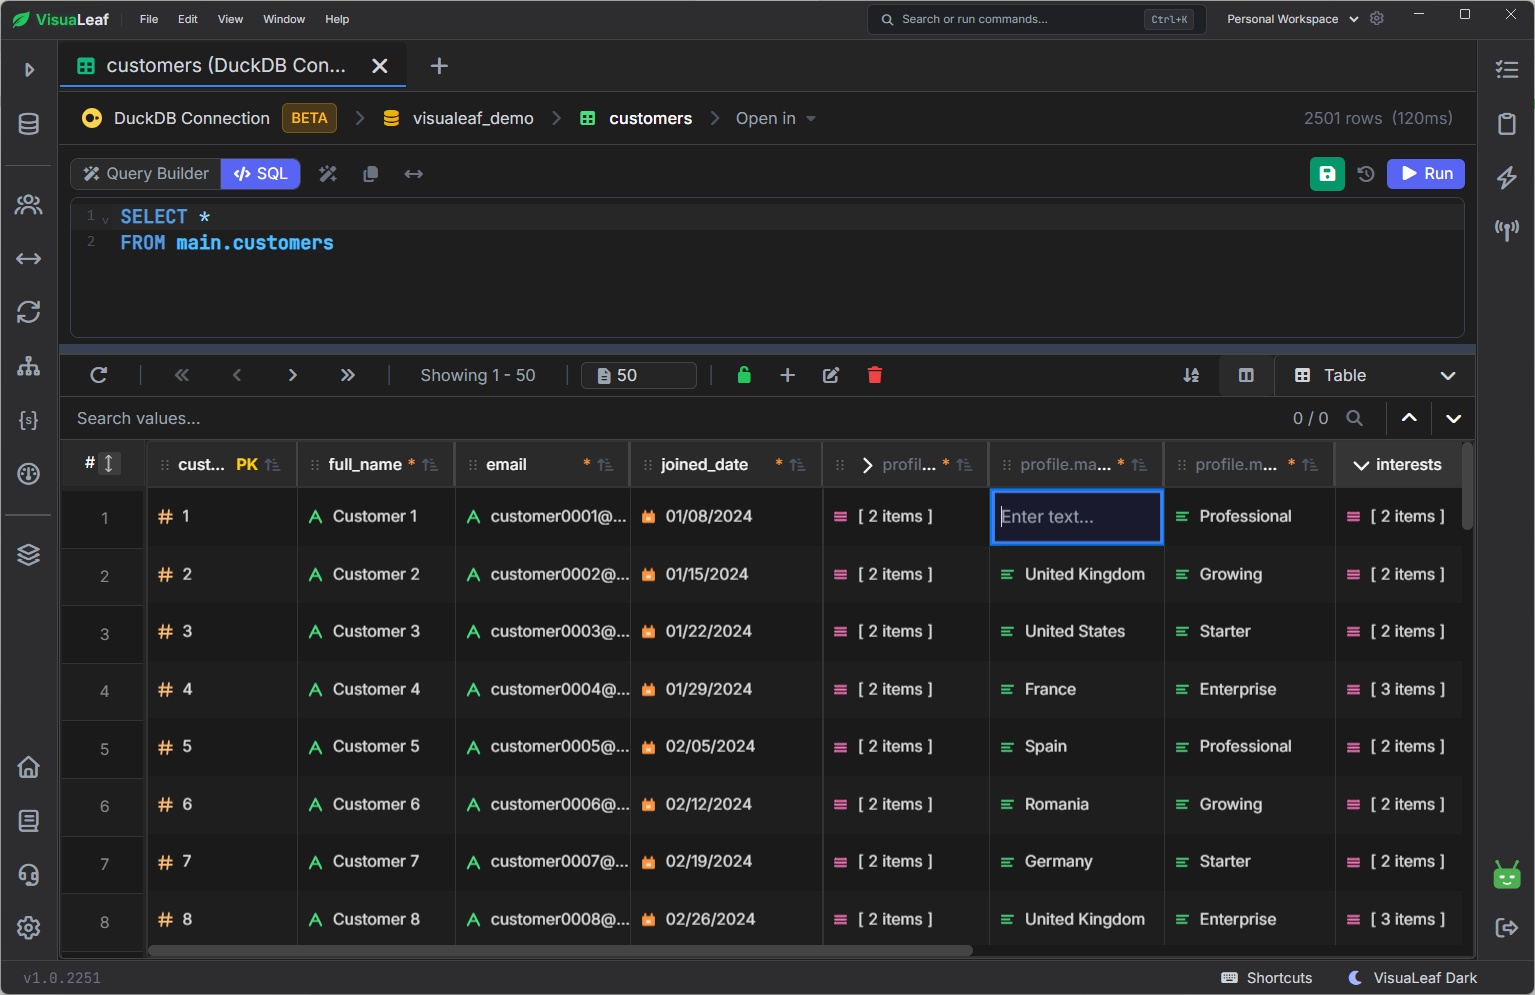
Query results are easier to inspect in a data grid than in terminal output, especially when a table contains many columns. You can open a table, sort or filter its records, compare values, and move through the results without writing a new query for every action.
You can also edit values inline or add a row directly from the grid. This works well for small corrections and test records. For bulk changes or operations you need to repeat, use an UPDATE or INSERT statement instead.
VisuaLeaf’s SQL Editor executes SQL only. Applications written in Python, R, or Java connect through their own DuckDB libraries; you cannot paste those languages into the SQL editor. The DuckDB GUI client page covers the complete visual interface.
How Do You Inspect Tables, Keys, and Data Types?
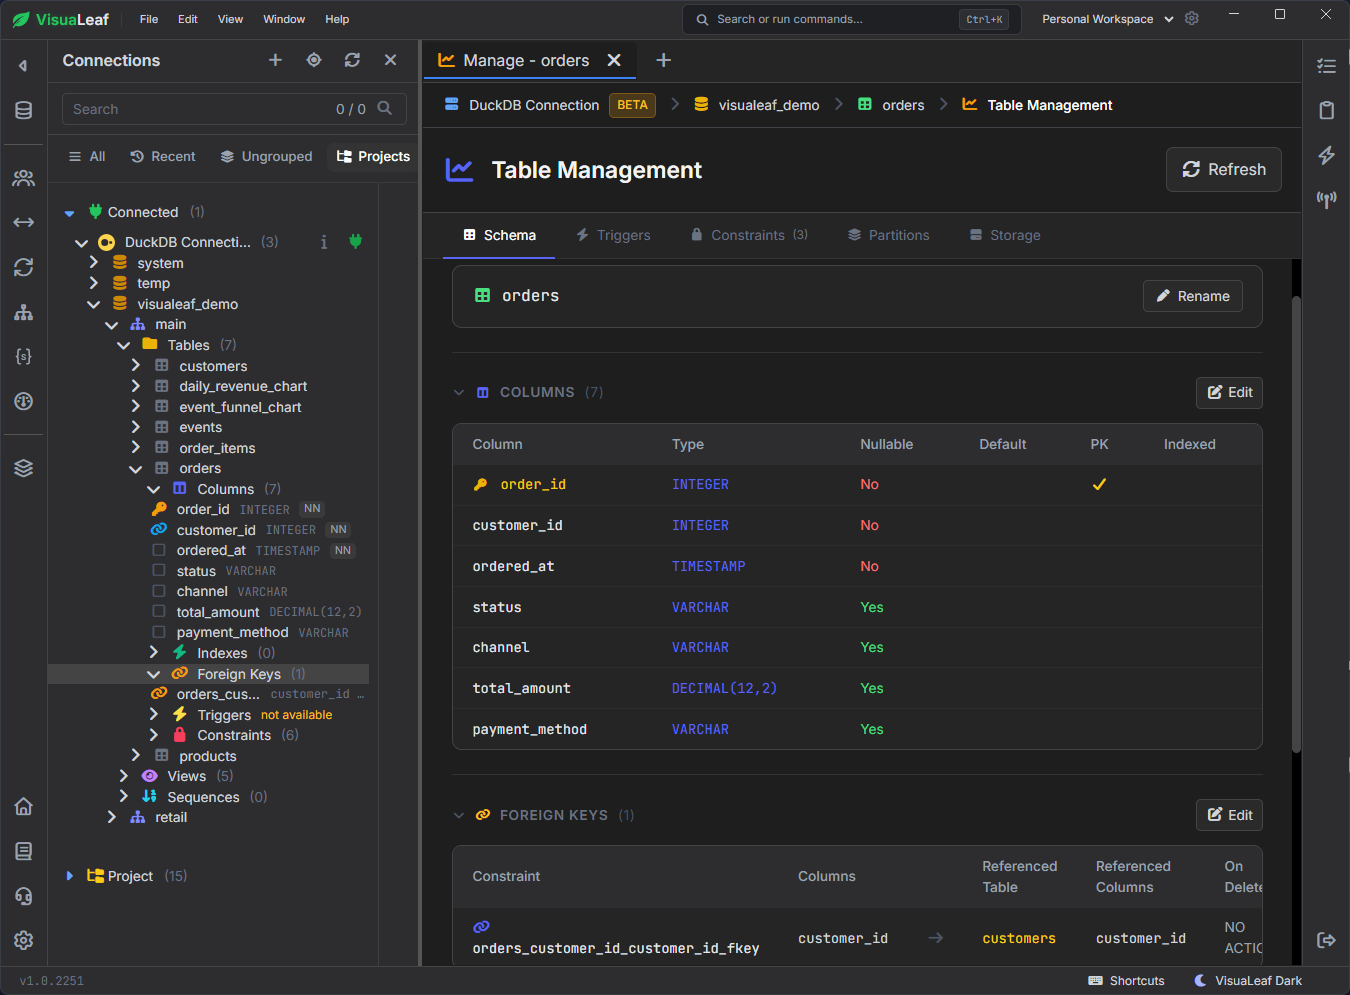
Before writing a query, it helps to check the table definition. In our orders table, order_id is an INTEGER primary key, customer_id is a foreign key, ordered_at uses the TIMESTAMP type, and total_amount is stored as DECIMAL(12,2).
The table editor also shows nullability, default values, indexes, and constraints. These details tell you what values a column accepts and whether it connects to another table.
The schema also uses nested data types. customers.profile is a STRUCT containing country and segment, while customers.interests is a VARCHAR[] list. You can access both with SQL:
SELECT
    customer_id,
    full_name,
    profile.country AS country,
    profile.segment AS segment,
    unnest(interests) AS interest
FROM main.customers
WHERE list_contains(interests, 'analytics')
LIMIT 20;
STRUCT and LIST keep related values together, but updating them can expose an index limitation. In our test, changing interests on a row with a primary key returned a duplicate-key error even though customer_id had not changed. Running the same update through SQL returned the same error, confirming that the visual editor did not cause it.
The documentation explains that some updates are processed as a delete followed by an insert, which can cause a constraint to be checked too early. The workaround is to delete and reinsert the row in separate transaction steps. Do not remove a valid primary key to make the edit succeed. See the index limitations before updating indexed rows with nested values.
How Do You Query Parquet and CSV Files Directly?
A CSV file stores rows as plain text. It is easy to open and widely supported, but it does not preserve database types reliably. Parquet is a column-based format designed for analytical data. It stores type information and can read only the columns a query needs. You do not need Parquet to start, but it becomes useful with larger analytical exports or data pipelines that already produce it.
DuckDB can query both formats without first copying them into permanent tables. read_parquet() opens a Parquet file as a queryable relation. read_csv_auto() reads a CSV file and detects its columns and types.
SELECT *
FROM read_parquet('C:/DuckDB/events.parquet')
LIMIT 10;
SELECT *
FROM read_csv_auto('C:/DuckDB/orders.csv', header = true)
LIMIT 10;The query below summarizes clickstream events from events.parquet, summarizes completed sales from orders.csv, and joins the two monthly results:
WITH parquet_activity AS (
    SELECT
        date_trunc('month', occurred_at)::DATE AS month,
        count(*) AS events,
        count(DISTINCT customer_id) AS active_customers,
        round(avg(properties.engagement_score), 1) AS avg_engagement
    FROM read_parquet('C:/DuckDB/events.parquet')
    WHERE occurred_at < TIMESTAMP '2025-11-01'
    GROUP BY ALL
),
csv_sales AS (
    SELECT
        date_trunc('month', ordered_at)::DATE AS month,
        count(*) FILTER (WHERE status = 'completed') AS completed_orders,
        round(
            sum(total_amount) FILTER (WHERE status = 'completed'),
            2
        ) AS revenue
    FROM read_csv_auto('C:/DuckDB/orders.csv', header = true)
    WHERE ordered_at < TIMESTAMP '2025-11-01'
    GROUP BY ALL
)
SELECT
    p.month,
    p.events,
    p.active_customers,
    p.avg_engagement,
    c.completed_orders,
    c.revenue
FROM parquet_activity AS p
JOIN csv_sales AS c USING (month)
ORDER BY p.month;
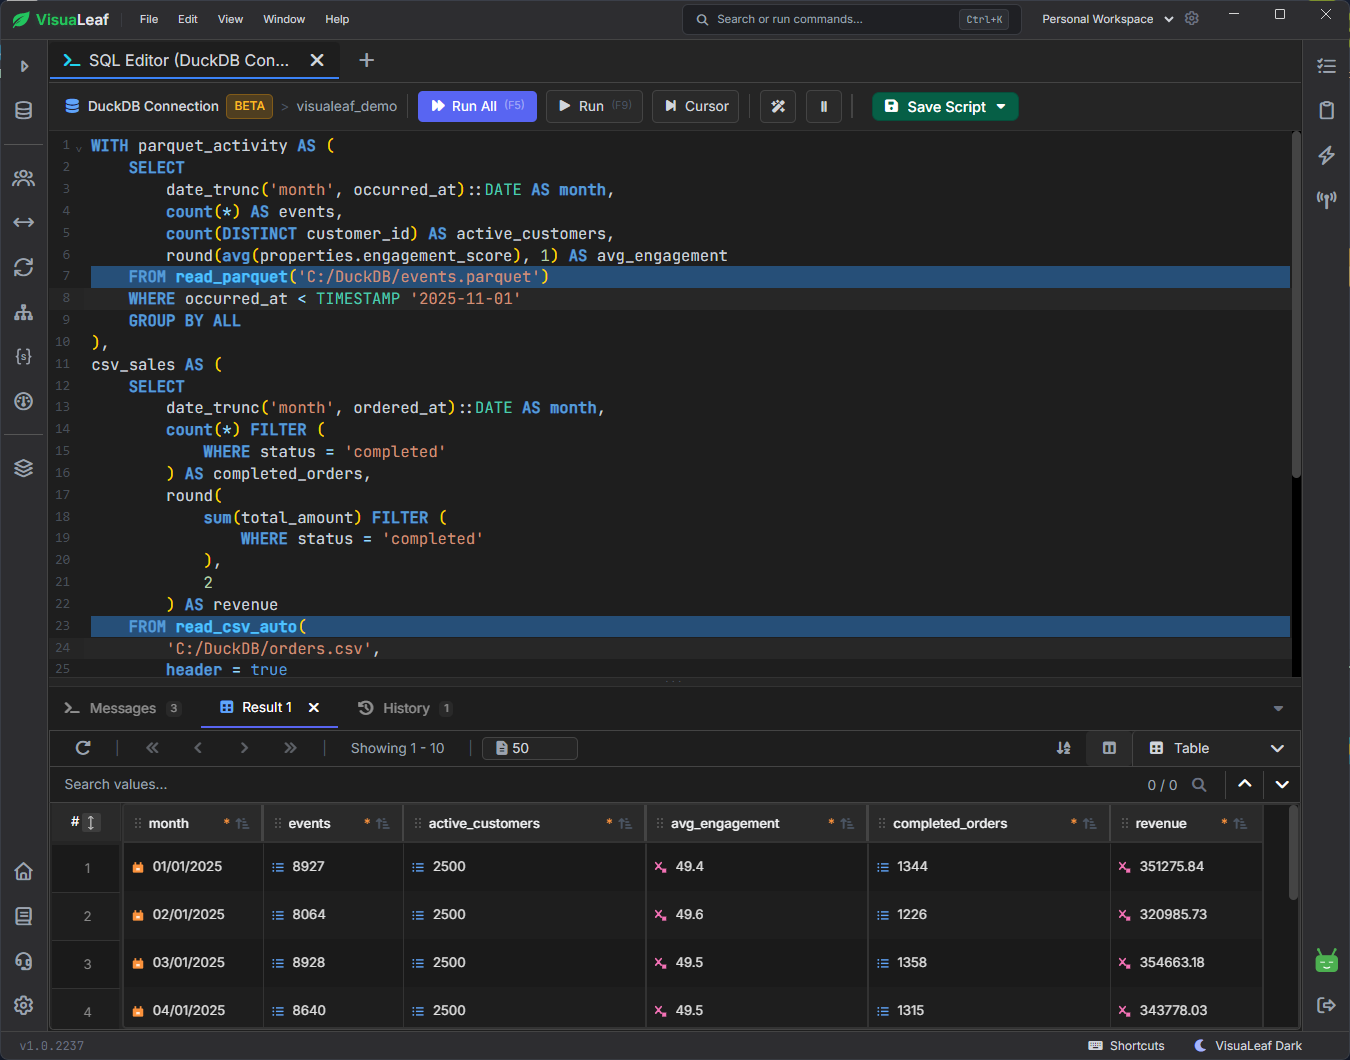
_events.parquet_ with revenue from _orders.csv_.Parquet supports projection and filter pushdown, so the engine can avoid reading columns or row groups that the query does not need. The file-format guide also explains when repeatedly queried data may perform better after loading it into database tables. For CSV, automatic detection is convenient, but you should specify column types if the inferred result is wrong.
Can You Visualize Tables and Relationships in an ER Diagram?
Our relational path is:
customers → orders → order_items → products
Primary keys identify each customer, order, product, and order item. Foreign keys connect orders.customer_id to customers.customer_id, while order_items.order_id and order_items.product_id connect each line to its order and product.
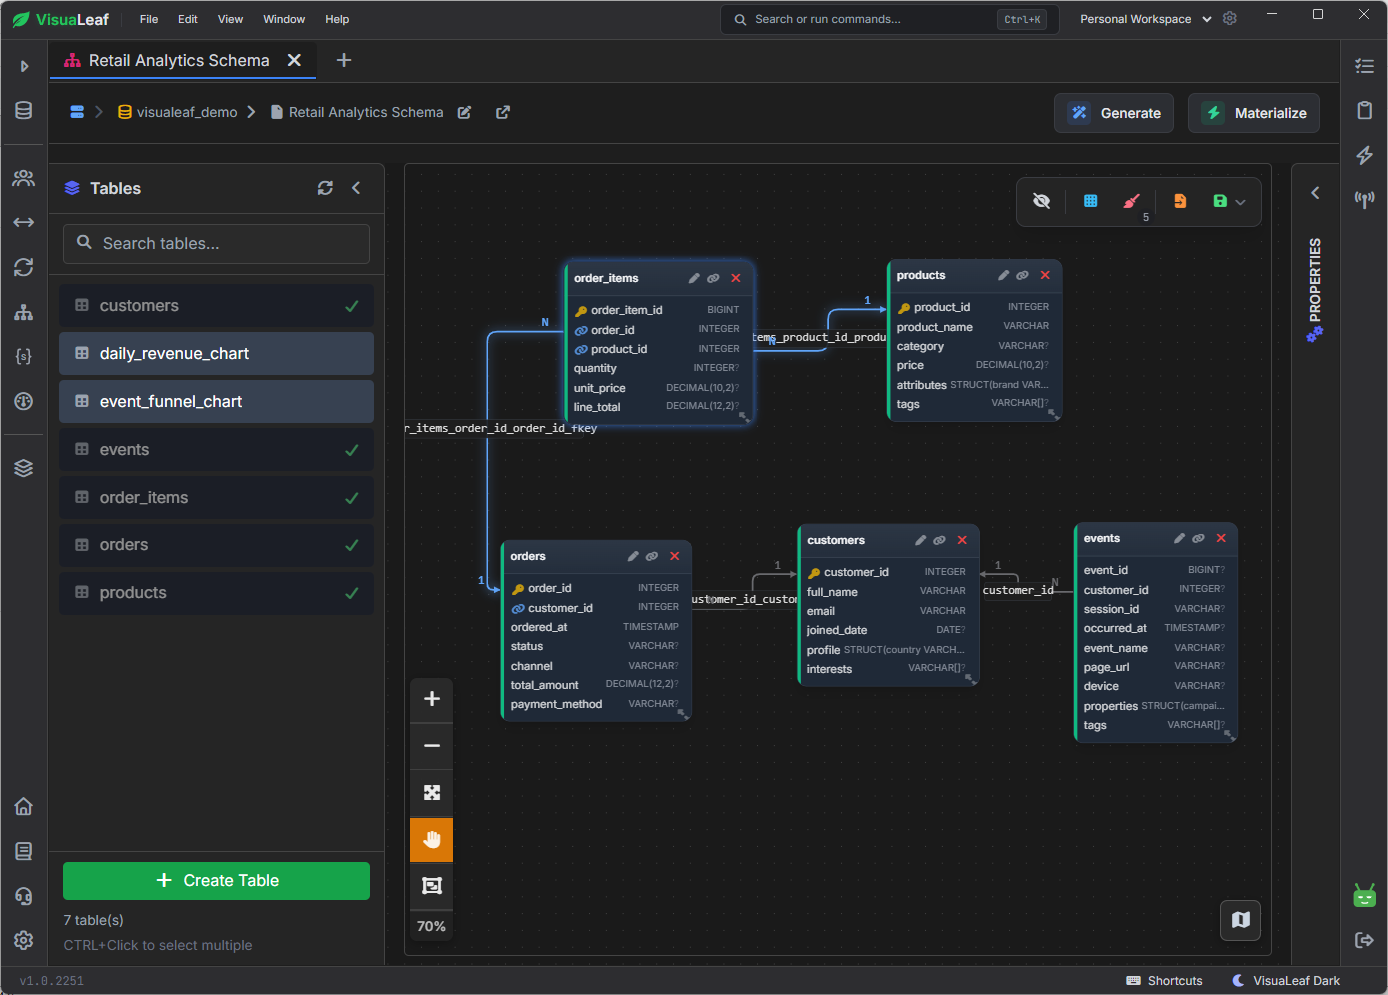
VisuaLeaf reads the existing keys and draws the relationships in an ER diagram. This makes the path from a customer to an order and its products easier to follow than reading separate CREATE TABLE statements. The events table remains outside that transactional path because it records customer activity rather than an order or product relationship.
How Do You Turn Query Results into Charts?
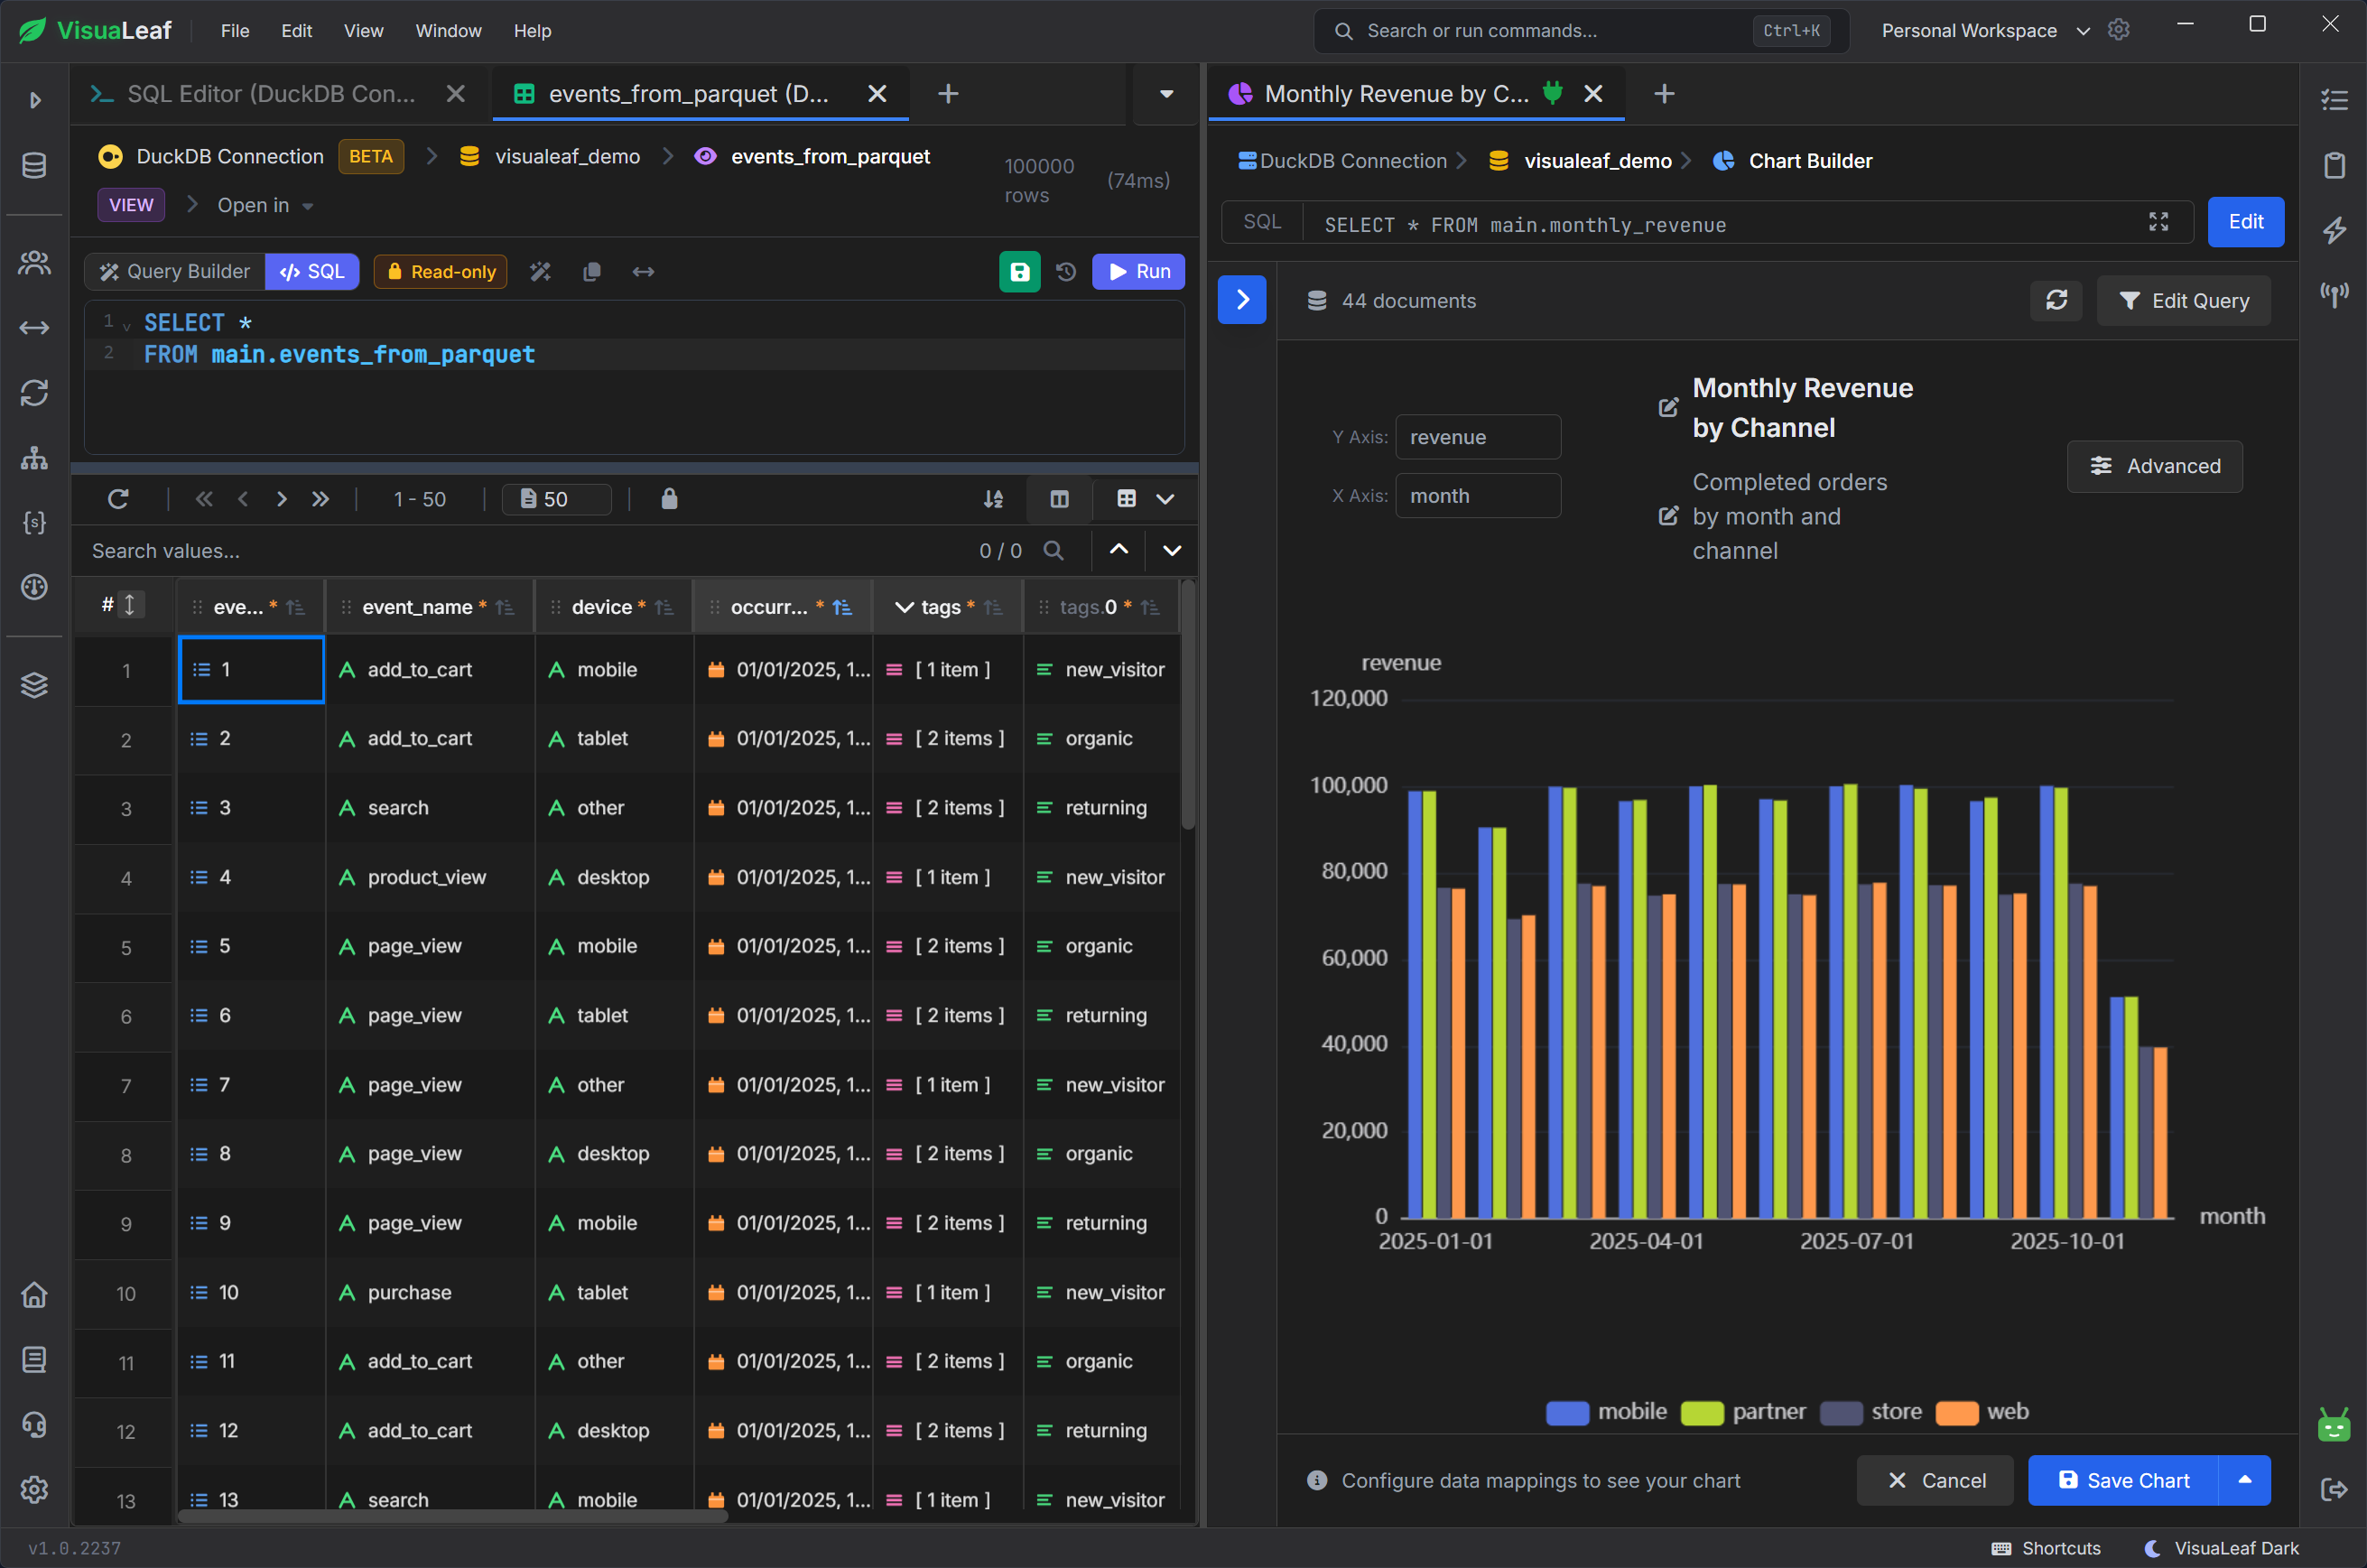
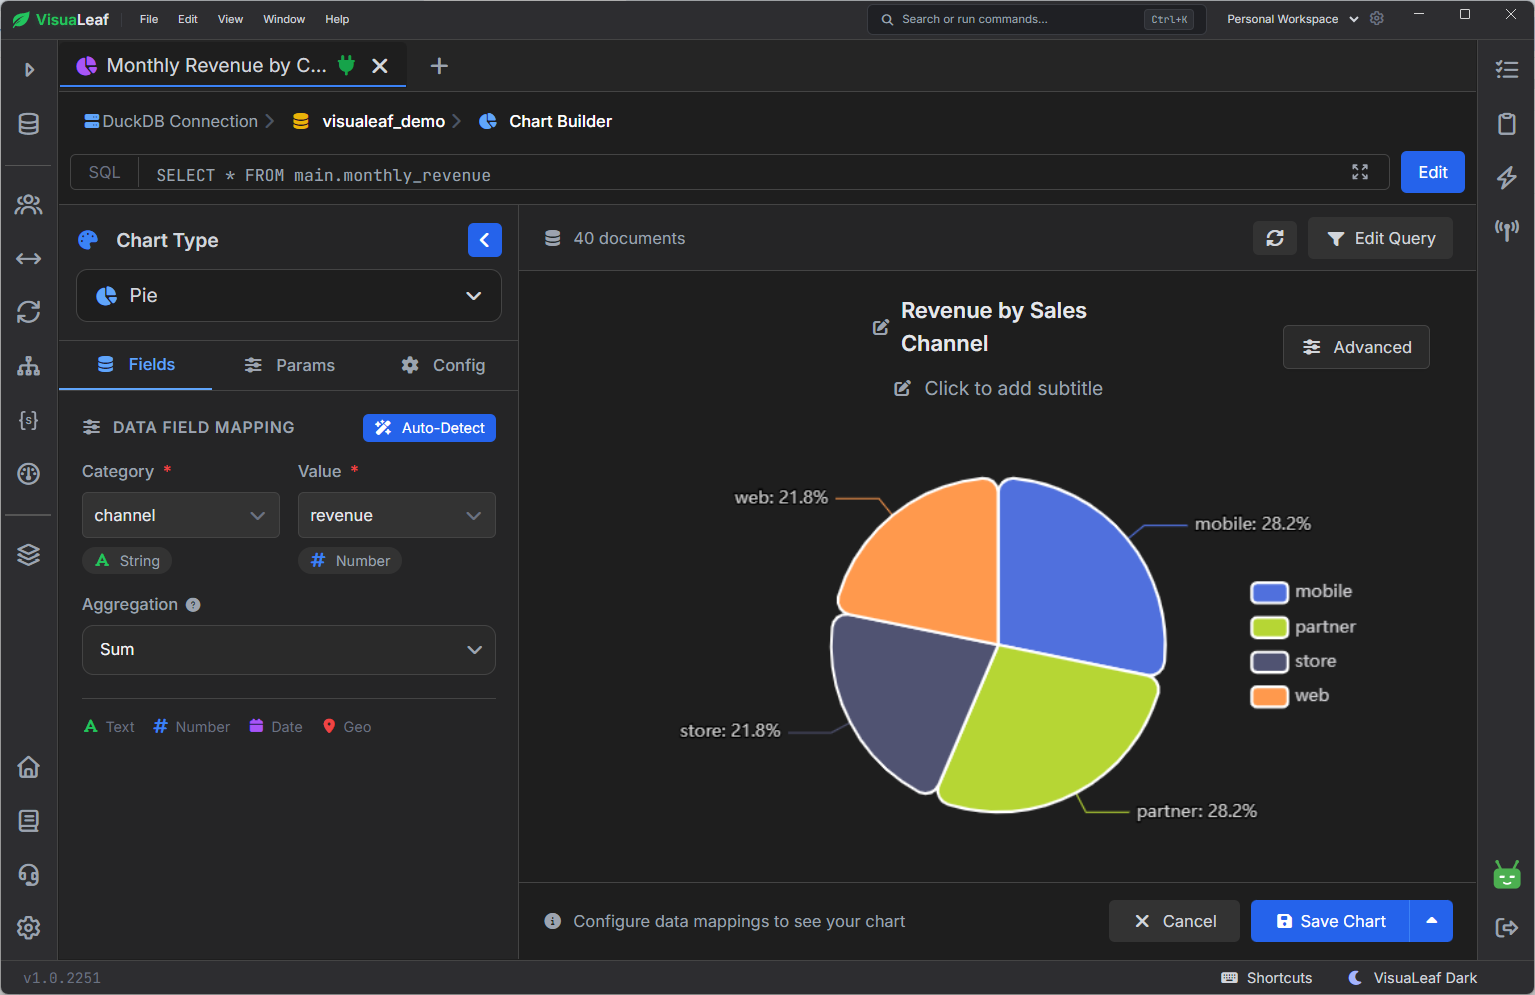
Query results can also become charts. In this example, we used the main.monthly_revenue view, selected channel as the category, and calculated the sum of revenue. The chart shows each channel’s share of total revenue across the selected period.
Mobile and partner sales generated the largest shares of revenue, while store and web contributed smaller shares. Charts make these differences easier to notice, but you should still verify the underlying SQL, filters, and aggregation settings.
Should You Use the CLI or a GUI?
Use the CLI for quick queries, repeatable scripts, and lightweight automation. Use a programming-language client when the database is embedded in a Python, R, Java, or another application. Use a GUI when you need to discover a schema, browse wide results, inspect data types, save SQL, view an ER diagram, or build charts while keeping the underlying data visible.
These options are not mutually exclusive. A persistent file can be created from the CLI, queried from an application, and opened visually. Just avoid concurrent writes from separate processes unless your connection pattern supports them.
Frequently Asked Questions
Do I need to convert a CSV file to Parquet first?
No. Query the CSV directly with read_csv_auto(). Consider Parquet when the dataset is large, you repeatedly read selected columns, or your existing workflow already produces it.
Do I need to import a Parquet file into a table?
No. You can query it directly with read_parquet(). Loading it into a table can still help when you run many repeated queries and want database statistics and storage optimizations.
Conclusion
DuckDB is useful when your data is local, your workload is analytical, and a traditional server would add more setup than value. You can keep data in one persistent file, query CSV and Parquet directly, inspect nested and relational structures, verify foreign keys, and turn SQL results into charts.
Start with one real question about your data. Open the database or source file, inspect its columns, write the smallest query that answers the question, and verify the result before adding another layer. That workflow works whether you prefer a command line, an application, or a visual client.
Want to try the same workflow with your own DuckDB database? Download VisuaLeaf for free to open your .duckdb file, explore its data, run SQL queries, view relationships, and create charts in one workspace.