Best Tools to Build MongoDB Aggregation Pipelines Visually in 2026
Compare the best tools for building MongoDB aggregation pipelines visually and see which one makes filtering, grouping, and data transformation easier.


Aggregation becomes difficult when you have to visualize the data as it changes in your mind.
Visual aggregation builders make this process much easier.
Instead of writing long JSON queries, you can add one stage at a time, preview the results, and immediately see how the data transforms.
In this post, I will create a small pipeline from the payments collection and replicate it in five tools:
This will help you understand what “visual” means in each tool.
The Example We Will Build
To keep things straightforward, we will build a small aggregation pipeline that shows:
The latest payments along with course details.
The pipeline will:
- Filter payments made in USD
- Sort them by the newest payment date
- Keep only the latest 10 payments
- Join the related course
- Display a clean result with the course title and category
Here is how you usually write an aggregation pipeline in shell:
db.payments.aggregate([
{ $match: { currency: "USD" } },
{ $sort: { paidAt: -1 } },
{ $limit: 10 },
{
$lookup: {
from: "courses",
localField: "courseId",
foreignField: "_id",
as: "course"
}
},
{ $unwind: "$course" },
{ $addFields: { courseCategory: "$course.category" } },
{
$project: {
_id: 0,
amount: 1,
currency: 1,
paidAt: 1,
courseCategory: 1,
courseTitle: "$course.title"
}
}
])
Here’s my trick for visual builders: I always verify one simple thing after each stage.
After $match, I confirm only the currency (or status) I want is present.
After $sort + $limit, I confirm I’m seeing the newest records.
After $lookup, I expect a new array field (here: course).
After $unwind, that array should become a single object.
After $addFields and $project, the output should look like a clean report table (amount, paid date, course title, category).
If those checkpoints look right, the pipeline is right.
Building the Same Pipeline in Different Tools
Now you will see how each of the following tools creates the same aggregation pipeline. The idea is not to alter the code but to demonstrate how each of the interfaces helps you create stages visually.
1. MongoDB Compass
Compass provides a structured stage editor and preview panel, making it a solid baseline for building aggregation pipelines visually.
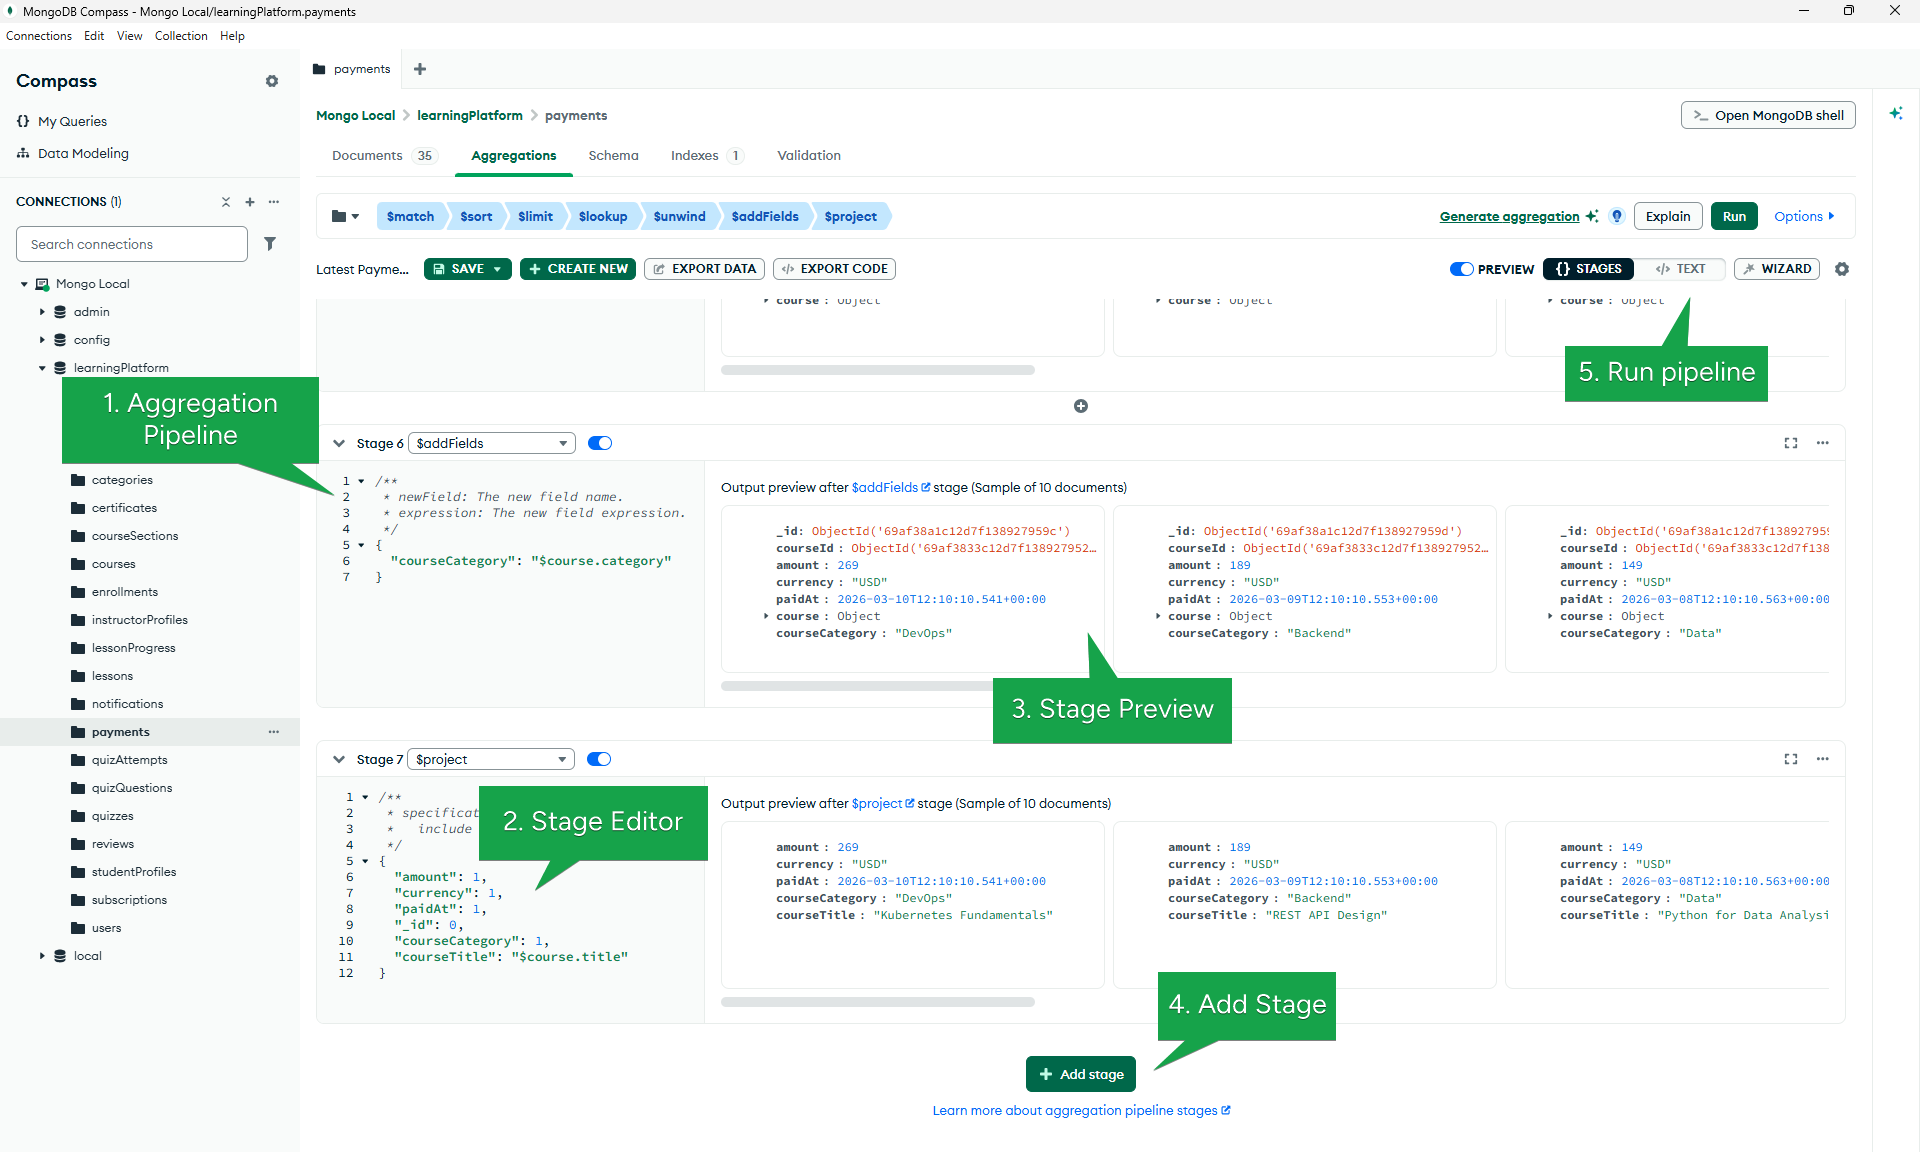
Small note: After clicking Run, Compass opens the full aggregation results view where you can explore the final output of the pipeline.
Build it
- Open payments → Aggregations and turn Preview on.
- Add $match and filter payments where
currency = "USD". - Add $sort and sort by
paidAtdescending. - Add $limit and set the value to
10. - Add $lookup to join the courses collection (
courseId → _id). - Add $unwind to flatten the
coursearray. - Add $addFields to extract
course.category. - Add $project to show the final fields.
The one thing I like about Compass is that I can easily test ideas. I can add a stage and view the results instantly. I can also modify the pipeline without exiting the interface. For learning aggregation pipelines, this makes a huge difference.
2. Studio 3T
Studio 3T is particularly useful for learning aggregation pipelines because it shows stage input and output, making debugging easier.
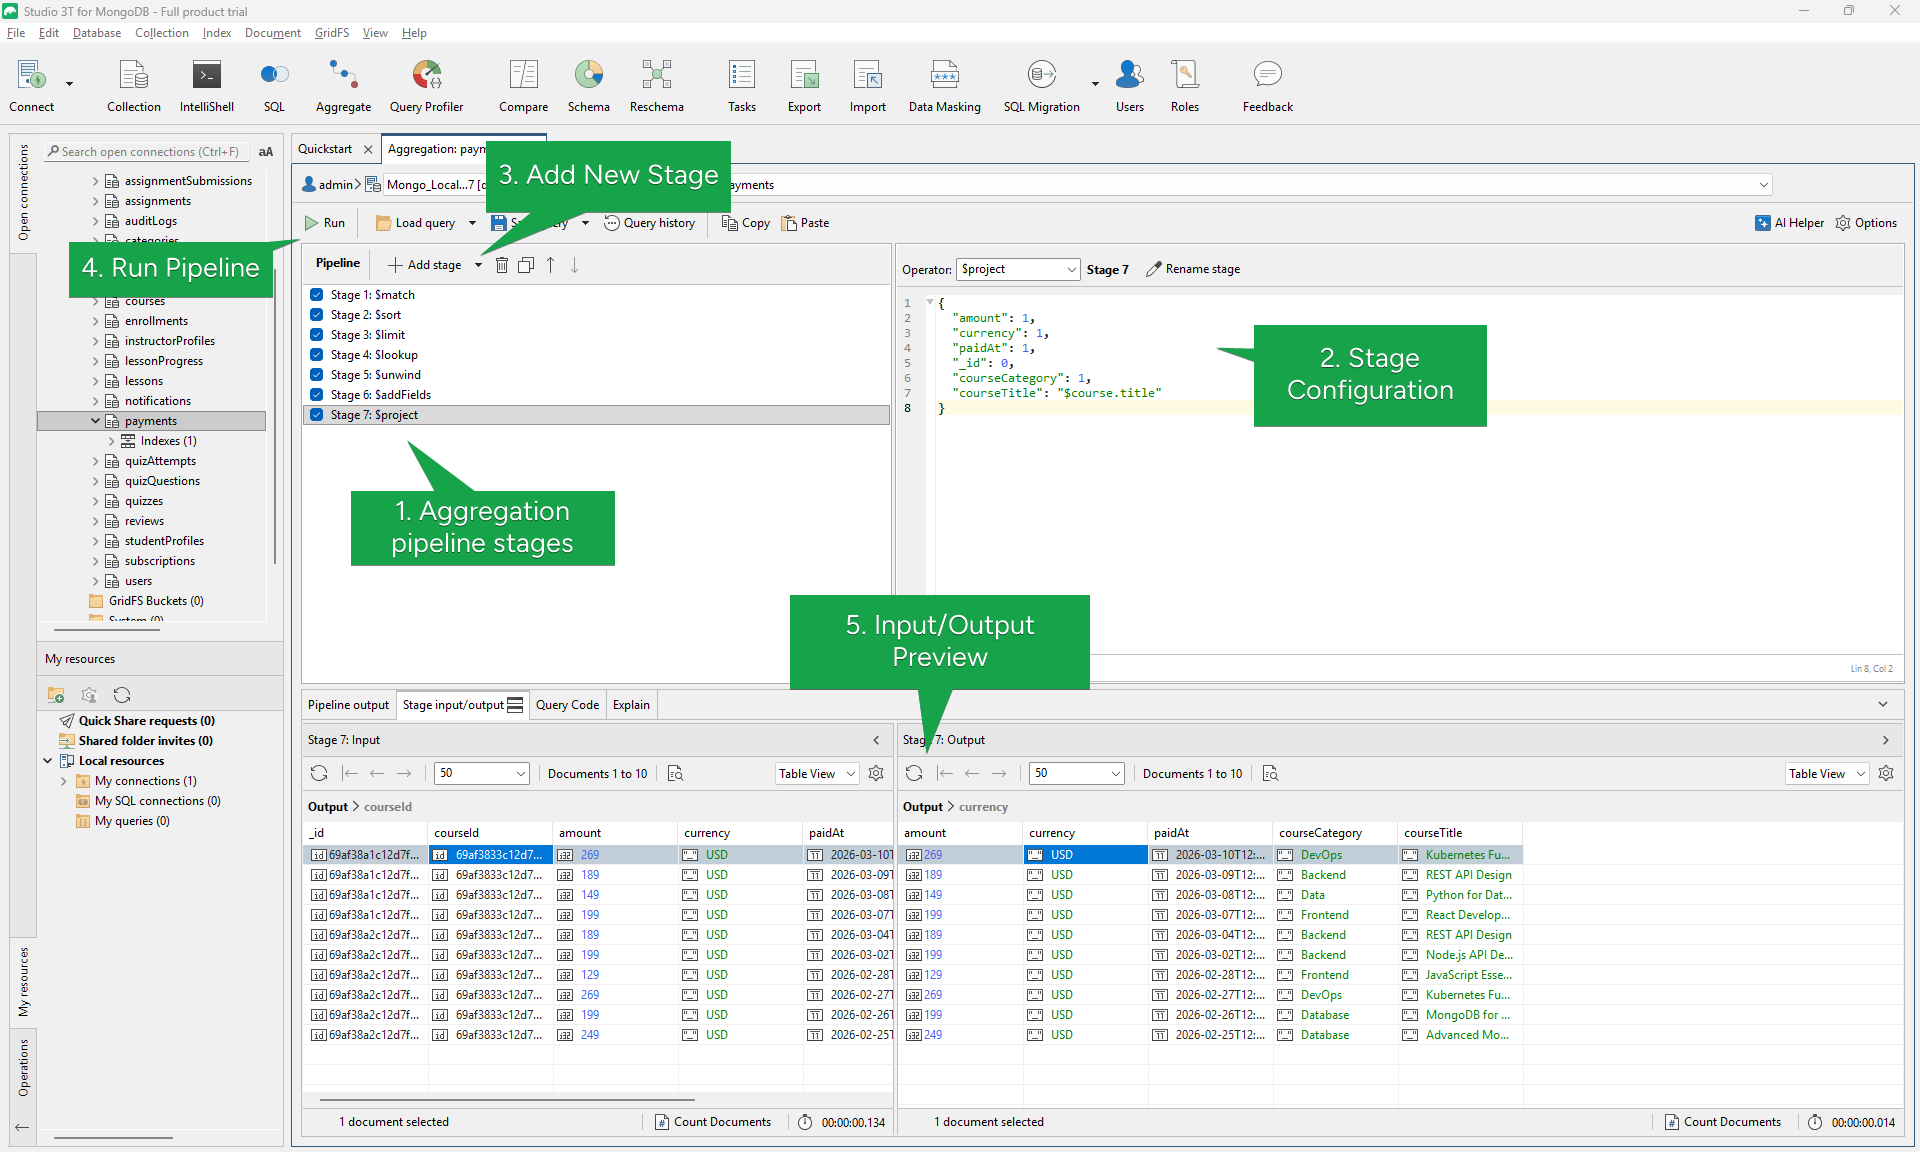
Build it
- Open payments → Aggregation Editor.
- Add stages in this order:
- $match
- $sort
- $limit
- Add $lookup to join the courses collection.
- Add $unwind on the
coursefield. - Add $addFields to create
courseCategory. - Add $project to define the final fields.
- Run the pipeline.
What I appreciate most in Studio 3T is that I can use the Stage Input/Output view. When something goes wrong in a pipeline, I can use this view to understand where the data changed and why. This makes debugging aggregation pipelines a lot easier.
3. VisuaLeaf
VisuaLeaf focuses on visual interaction.
The interface includes a stage palette with 37+ stages, form-based configuration, and an optional JSON editor when needed.
Read this article if you want to learn how to create a MongoDB Aggregation Pipeline Explained Step by Step in Visualeaf.
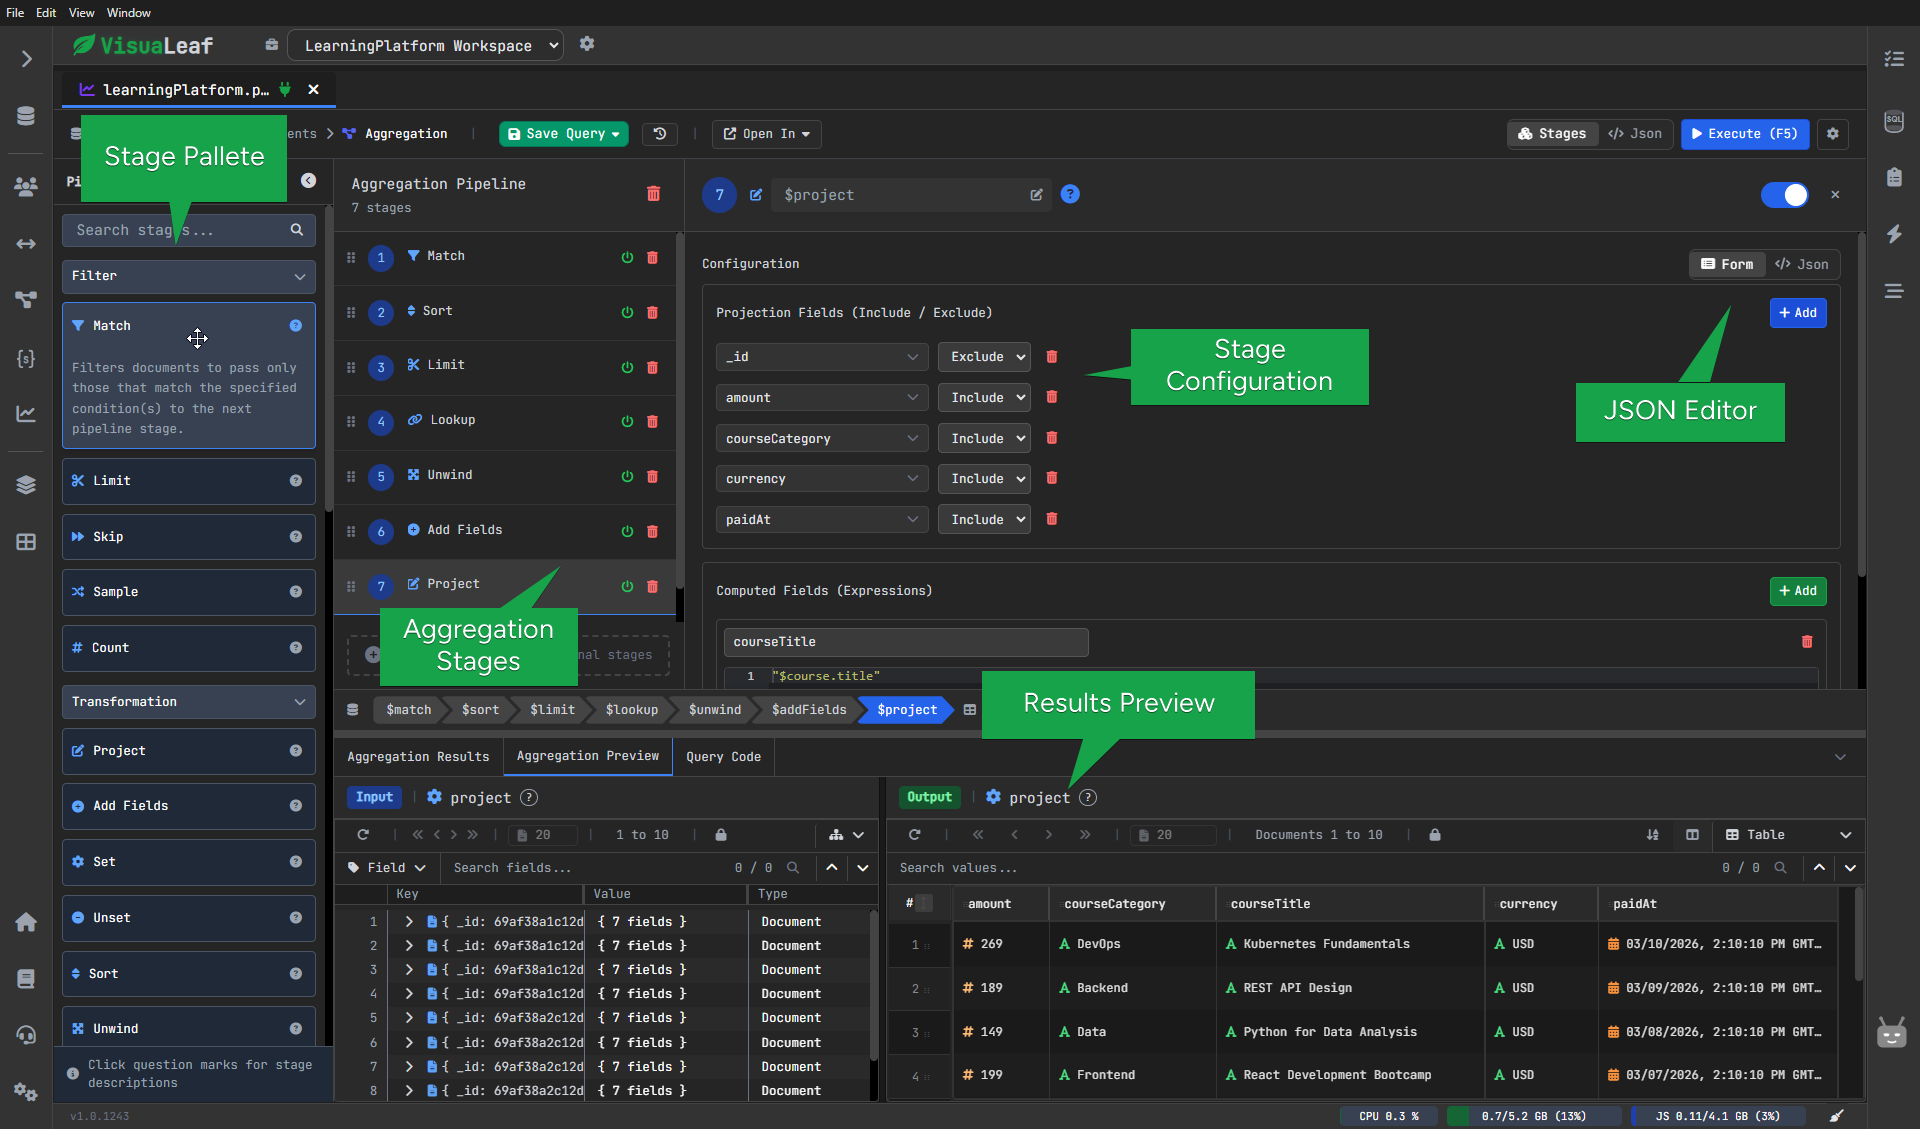
Build it
- Open payments → Aggregation.
- Drag Match from the stage palette and filter
currency = USD. - Add Sort and order by
paidAtdescending. - Add Limit and set it to
10. - Add Lookup to join the courses collection.
- Add Unwind on the
coursefield. - Add Add Fields to extract
course.category. - Add Project to define the final result fields.
- Execute the pipeline.
What I find most useful in VisuaLeaf is how easy it is to build and understand pipelines visually. You can drag and drop stages, configure them without writing JSON, and immediately see how the data changes after each step.
4. Navicat for MongoDB
Navicat presents aggregation pipelines as visual diagrams, which makes the data flow easier to follow.
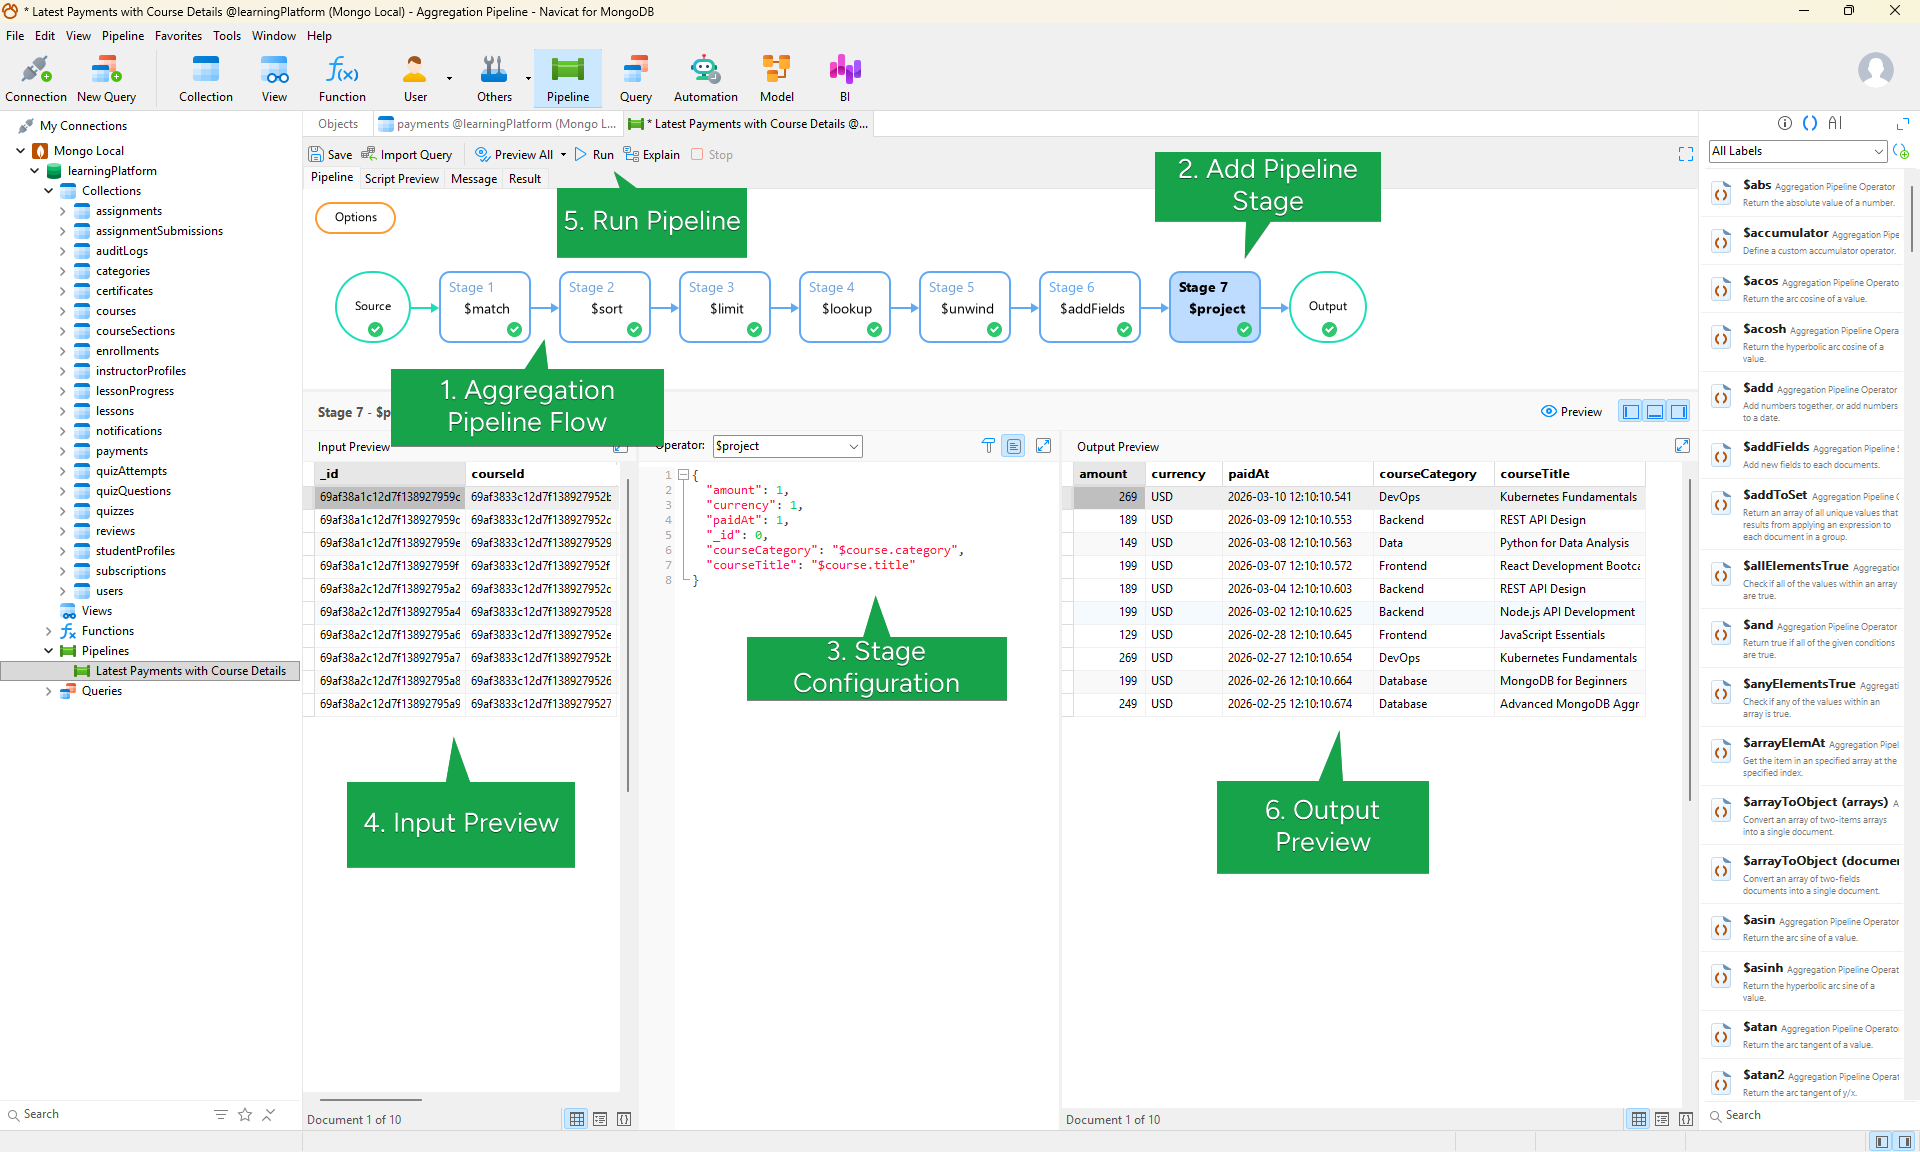
Build it
- Open payments → Aggregation Pipeline.
- Add $match, $sort, and $limit.
- Add $lookup to join courses.
- Add $unwind on the
coursefield. - Add $addFields to extract the course category.
- Add $project to format the final output.
- Run the pipeline.
The the diagram view in Navicat is that I can see the aggregation pipeline easily. The diagram view allows me to view the stages connected and makes me think about the pipeline as a flow rather than a sequence.
5. NoSQL Manager
NoSQL Manager is mainly a shell-driven tool with GUI support.
It does not provide a visual pipeline builder but still allows you to run aggregation queries easily.
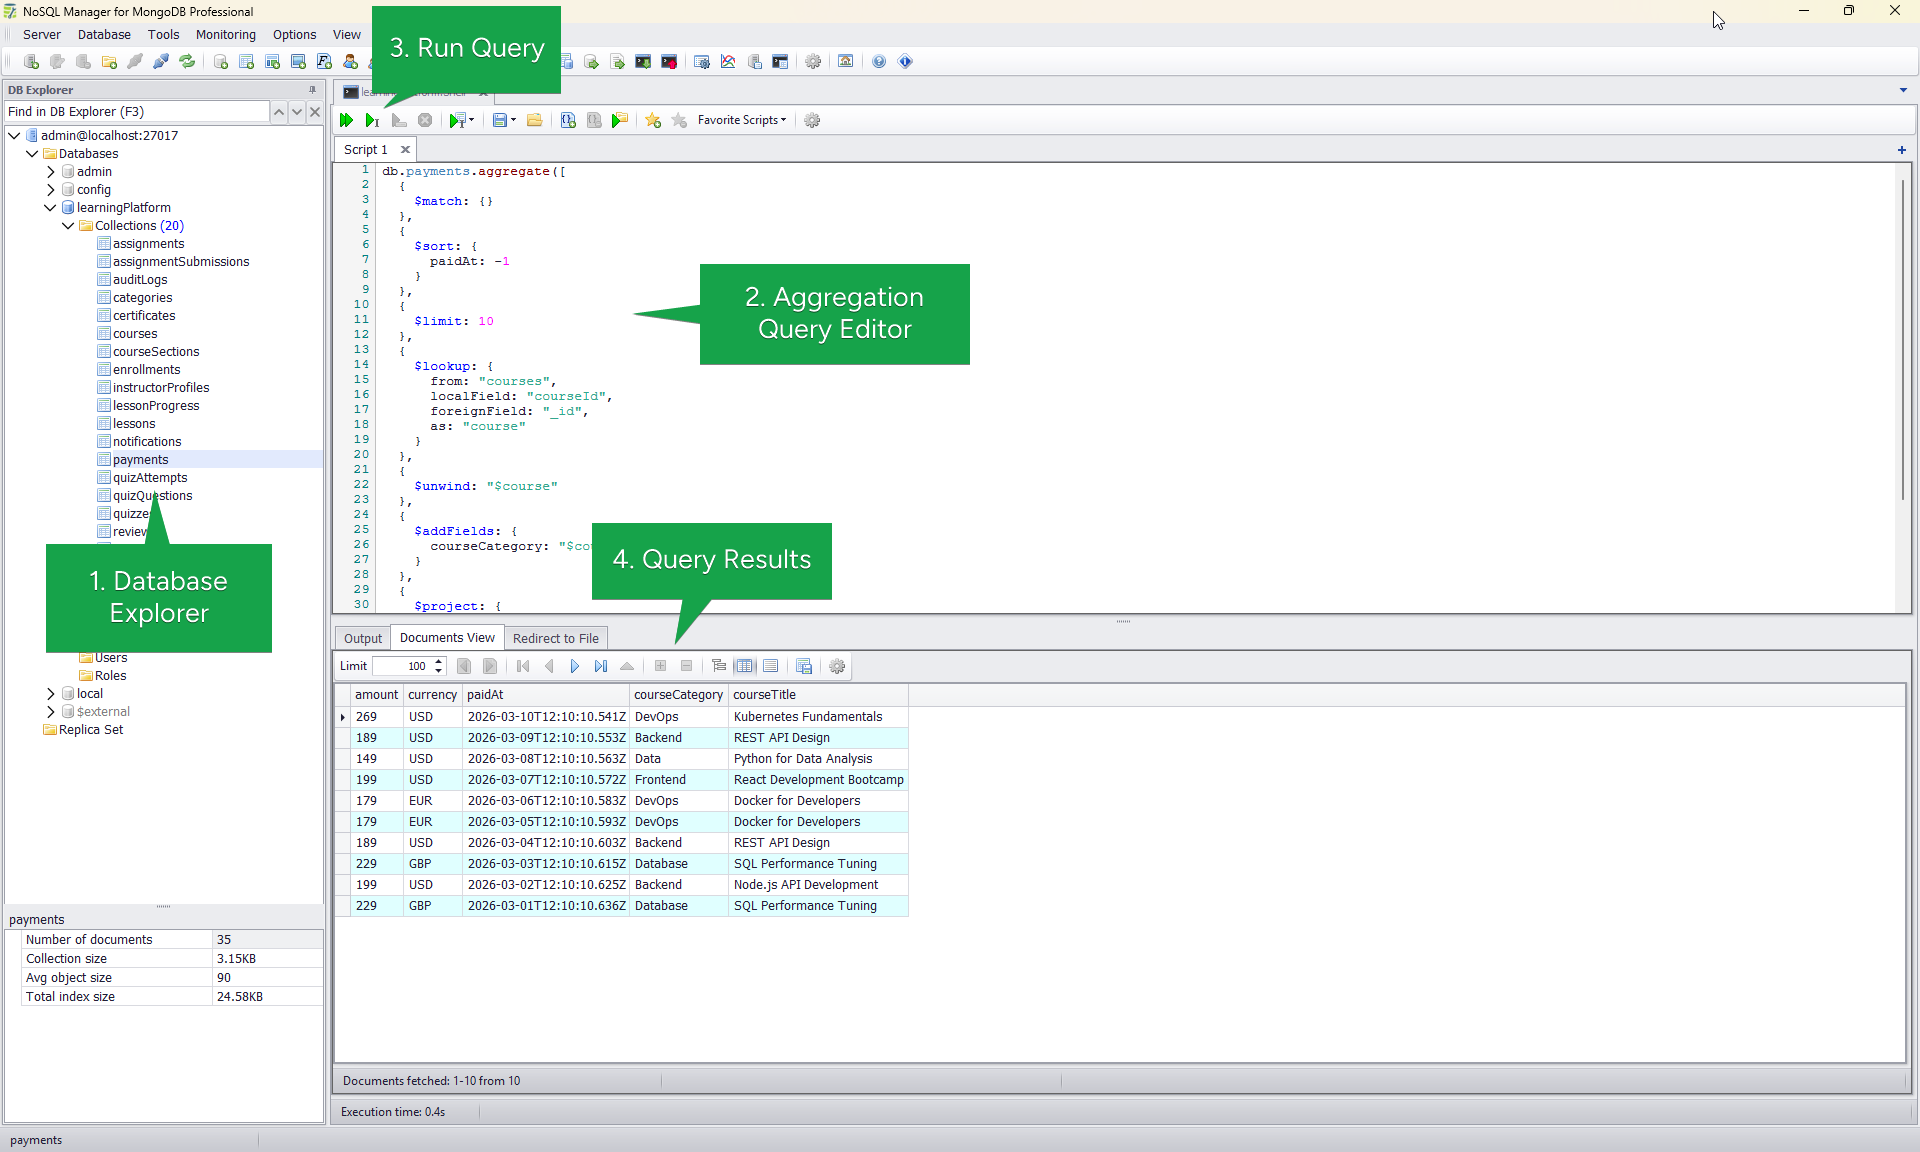
Run it
- Open the MongoDB UI Shell.
- Write or paste the aggregation pipeline.
- Execute the query.
- Inspect the results in the output grid.
- Debug by running parts of the pipeline.
If you're comfortable writing MongoDB queries yourself, the built-in shell of NoSQL Manager is actually pretty nice if you need it. It has autocomplete, even though it lacks a visual pipeline building interface.
For Quick Decision-Making
| Tool | Visual Builder | Drag & Drop | Stage Preview | JSON Fallback |
|---|---|---|---|---|
| MongoDB Compass | ✔ | Limited | ✔ | ✔ |
| Studio 3T | ✔ | Limited | ✔ | ✔ |
| VisuaLeaf | ✔ | ✔ | ✔ | ✔ |
| Navicat for MongoDB | ✔ | ✔ | ✔ | ✔ |
| NoSQL Manager | ✘ | ✘ | ✘ | ✔ |
Aggregation pipelines can look complicated when written as JSON, but visual tools make the process much easier to follow. By building the pipeline step by step and checking the preview after each stage, it becomes much clearer how the data changes.
Once you get used to this workflow, creating aggregation pipelines starts to feel much more intuitive.
A good way to learn aggregations from scratch is here: https://www.w3schools.com/mongodb/mongodb_aggregations_intro.php