A Faster Way to Build MongoDB Queries Visually Learn how to build MongoDB queries visually with drag and drop, AI help, real-time query generation, and flexible result views in VisuaLeaf.
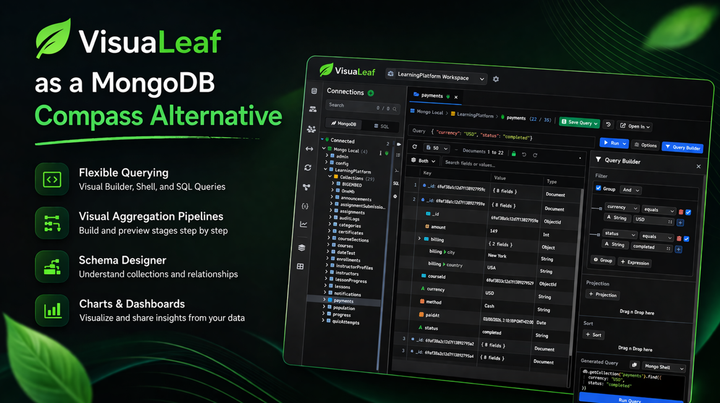
VisuaLeaf as a MongoDB Compass Alternative Looking for a better way to work with MongoDB than Compass? Discover how a modern visual tool can simplify queries, aggregation pipelines, and schema exploration.
A Smarter MongoDB Shell with Built-In Visual Output Working in the MongoDB shell doesn’t have to mean raw JSON only. See how visual output can make queries easier to understand and faster to debug.
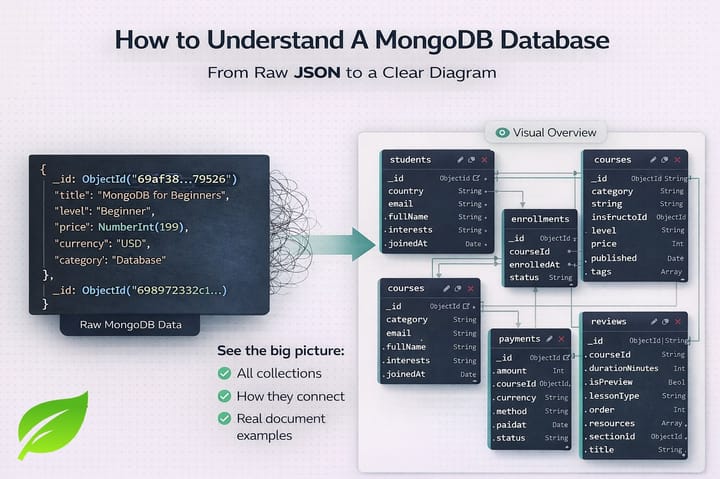
How to Understand a MongoDB Schema | From Raw JSON to Diagrams Struggling to understand your MongoDB structure from raw JSON? Learn how to turn collections into clear visual diagrams and see how everything connects.
How to Explore and Work with MongoDB Data Visually Exploring MongoDB data becomes much easier when you can see it. Learn how to browse, query, and understand your data using visual tools instead of raw documents.
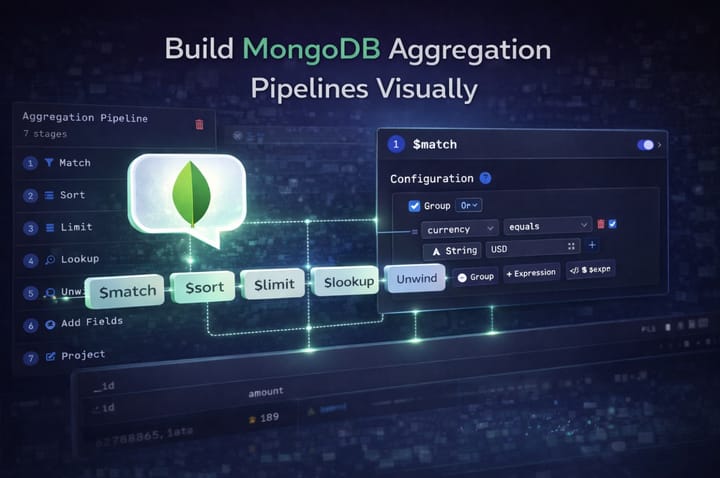
Best Tools to Build MongoDB Aggregation Pipelines Visually in 2026 Compare the best tools for building MongoDB aggregation pipelines visually and see which one makes filtering, grouping, and data transformation easier.
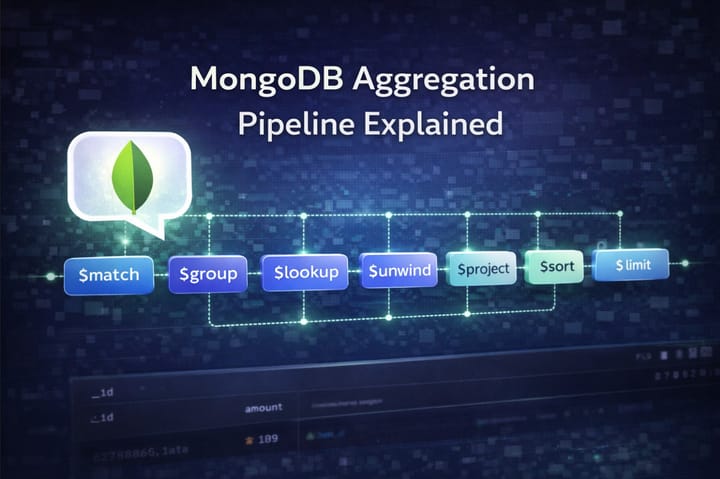
MongoDB Aggregation Pipeline Explained Step by Step Learn how MongoDB aggregation pipelines work step by step, with clear examples and visual explanations.