How to Visualize a MongoDB Schema from JSON to Diagram
Struggling to understand your MongoDB structure from raw JSON? Learn how to turn collections into clear visual diagrams and see how everything connects.


When you work with MongoDB, everything feels simple at first.
You open a collection, look at a few documents, and it all makes sense.
For example, here’s a single collection with a few documents.
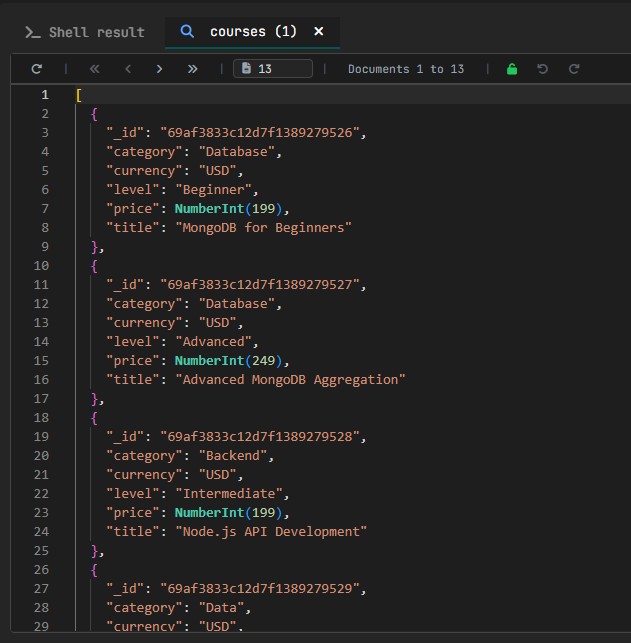
Everything is in one place, and it’s easy to follow.
You don’t need anything else to understand your data.
When the database grows, things change
At first, your ''learningPlatform'' database might look like this:
You have students, courses, and enrollments connecting them.
Nothing complicated. You can understand everything by looking at the data.
But the real projects are not like this.
They grow. They start to grow when new features are added.
You add:
lessonsquizzesreviewscertificatesprogresssubscriptionsinstructorscategories
But now it’s not just one collection.
You want to understand how everything fits together, but it takes time, and you’re always piecing things together in your head.
The problem is not the data
If you only read documents, you are always looking at things from the lowest level.
But your database is not a collection of documents.
It’s a system.
Start by seeing the structure
The first step is easy:
What does this database look like as a whole?
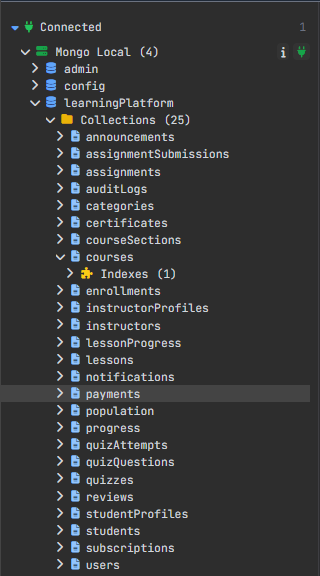
Instead of opening collections one by one, you look at at them as a group.
You immediately see:
- which collections exist
- which ones are important (
students,courses) - which ones connect data (
enrollments,payments) - which ones add more detail (
lessons,quizzes,reviews,progress)
For this, I used VisuaLeaf to generate a visual diagram of the database.
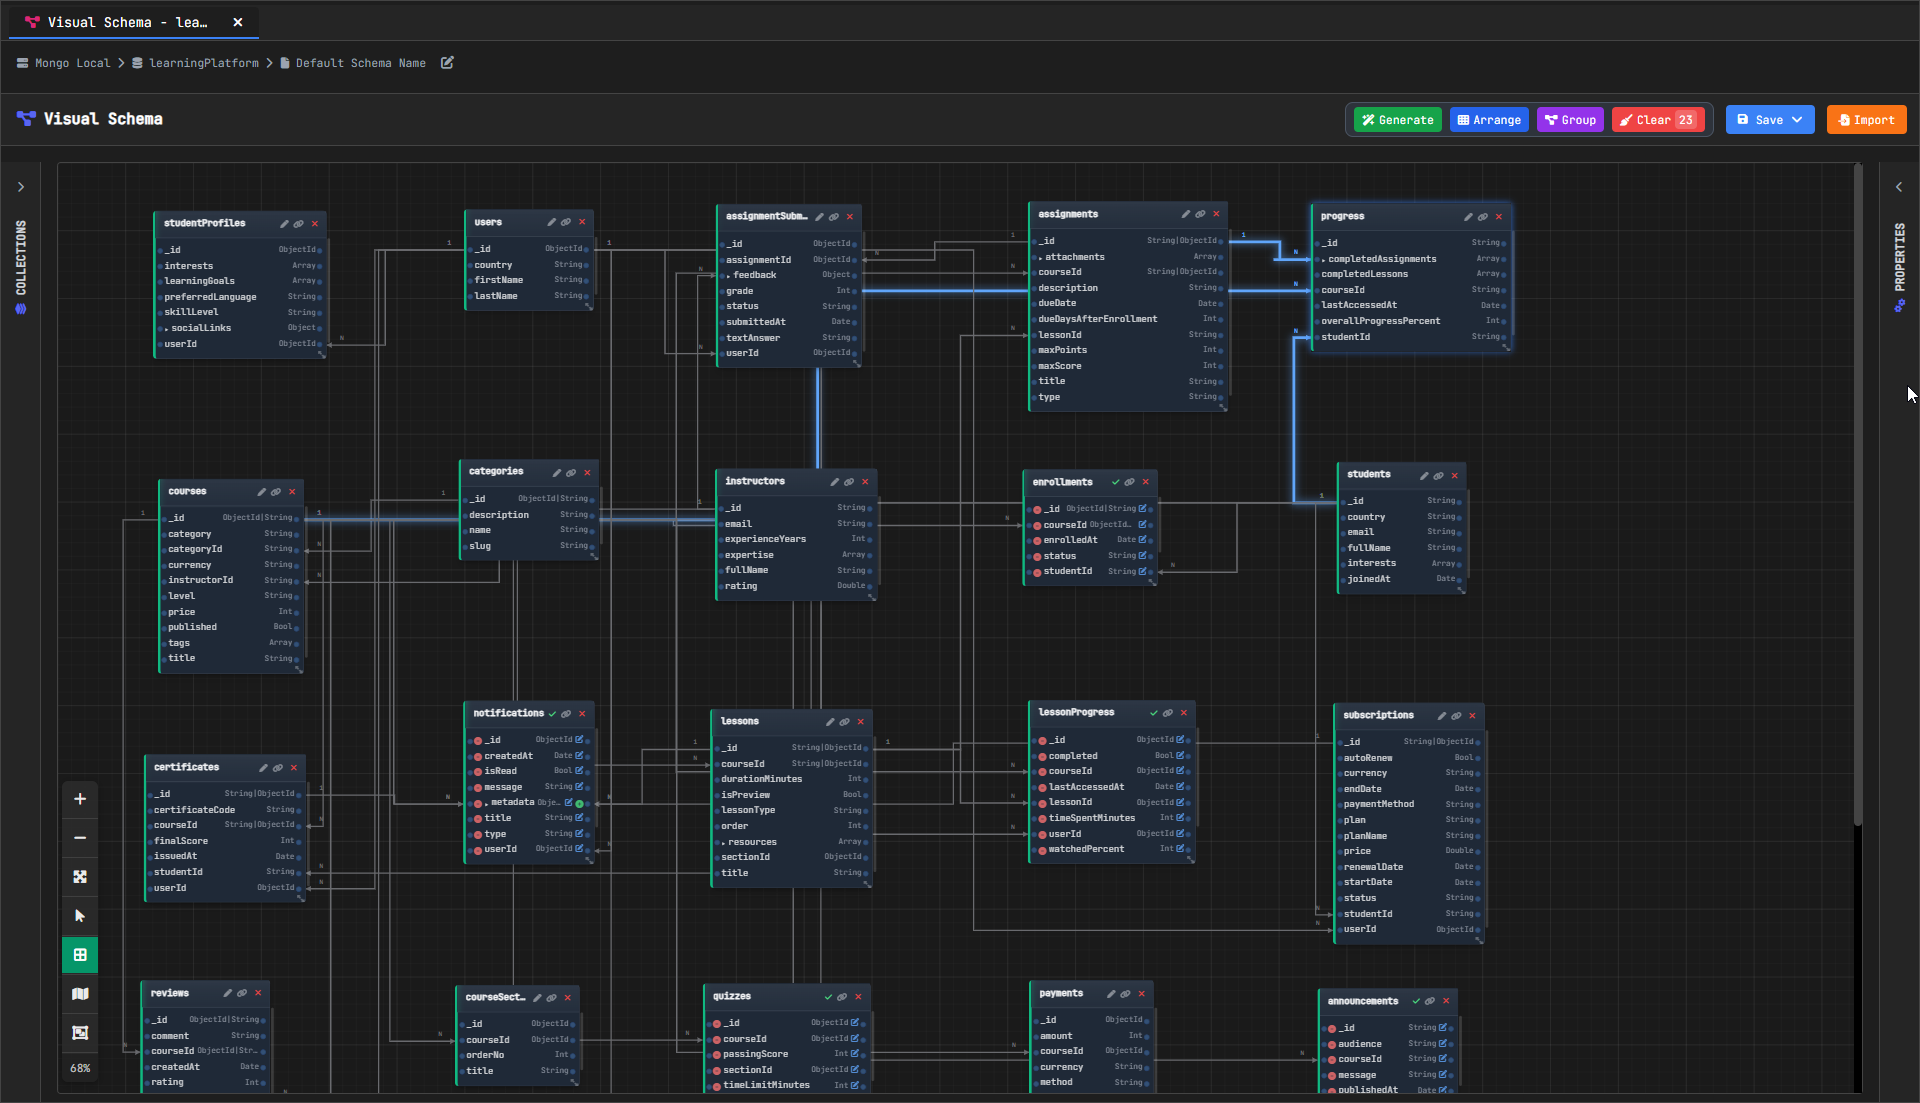
A diagram shows you a complete overview of all collections and how they are structured, not because it looks pretty, but because it shows the big picture.
Then understand the connections
Once you see the collections, the next question is:
How do these pieces connect?
In a MongoDB database, relationships are not enforced like in SQL.
They are just fields.
studentIdcourseIdlessonId
But those fields tell a story:- a student enrolls in a course
- a course contains lessons
- a lesson can have a quiz
- a student leaves a review
- a student can earn a certificate
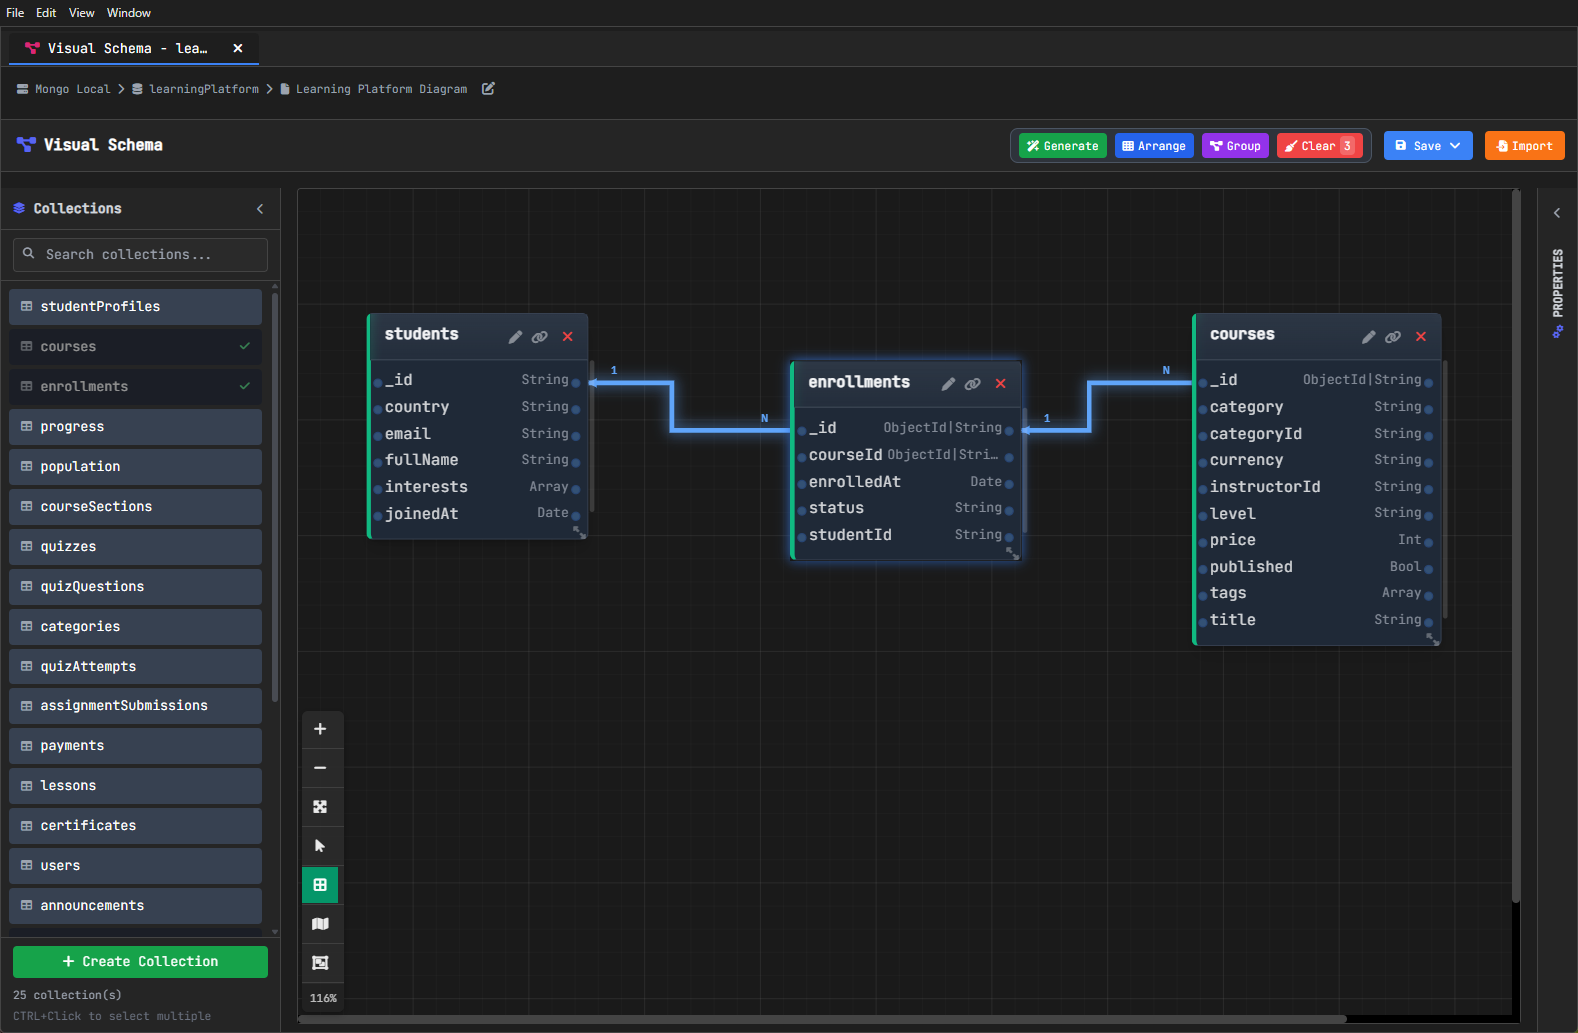
Once you see this visually, it makes it much easier to follow.
A diagram is not enough, it just shows you the structure.
But it doesn’t show you how the data actually looks.
Look at the data, not just the structure
Open a collection like progress.
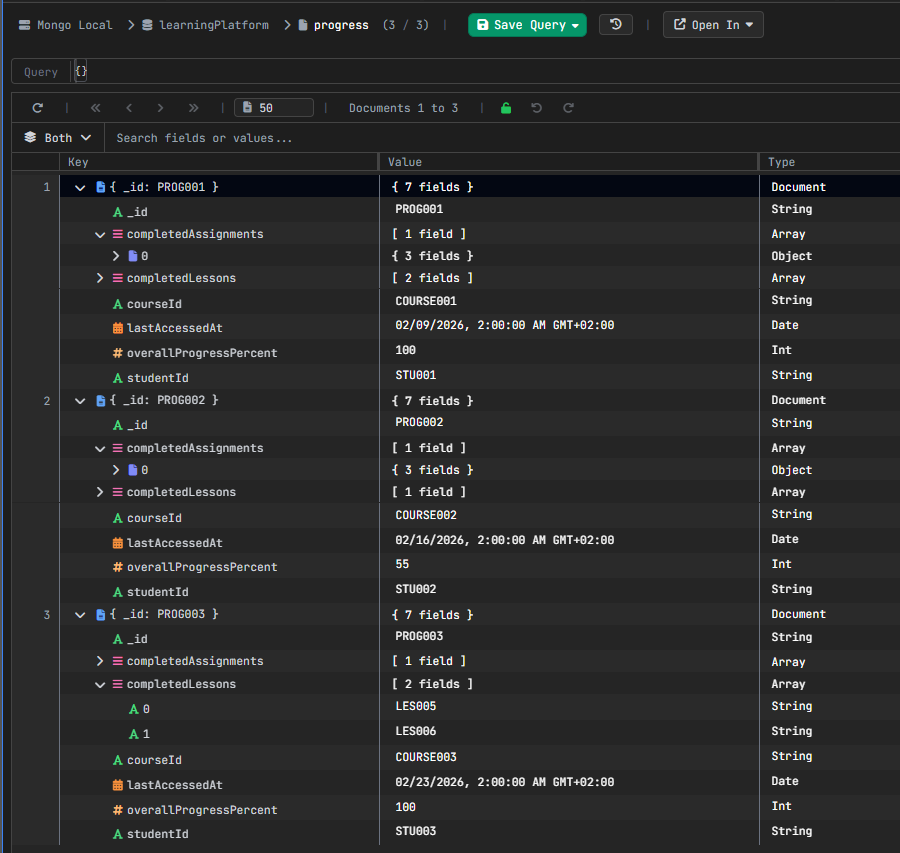
You start to see something different now.
Not only fields, but real data too:
- arrays (
completedLessons) - nested objects (
completedAssignments) - multiple values and formats
This is where MongoDB is powerful.
And where it becomes hard to read.
It’s easy to understand one document.
It’s much harder to see the pattern across many of them.
Structure + Data = Understanding
This is the main idea.
To understand a MongoDB database, you need both:
- structure → how collections connect
- data → how documents actually look like
One without the other is not enough.
Where VisuaLeaf fits in
This is where VisuaLeaf helps.
Not by adding more complexity, but by making things easier to see:
- you see the structure as a diagram
- you explore collections and their fields
- you look at real documents and patterns
Instead of guessing how everything fits together, you can actually see it.
Putting it all together
Every MongoDB project reaches this point.
At the beginning, reading a few documents is enough.
Later, it isn’t.
You don’t need more data.
You need to see how everything is connected.
If you want to go a step further and explore your data in more detail, you can read this guide:
https://visualeaf.com/blog/how-to-explore-and-work-with-mongodb-data-visually/
If you want to learn what is a diagram, you can read this article: https://www.geeksforgeeks.org/dbms/introduction-of-er-model/